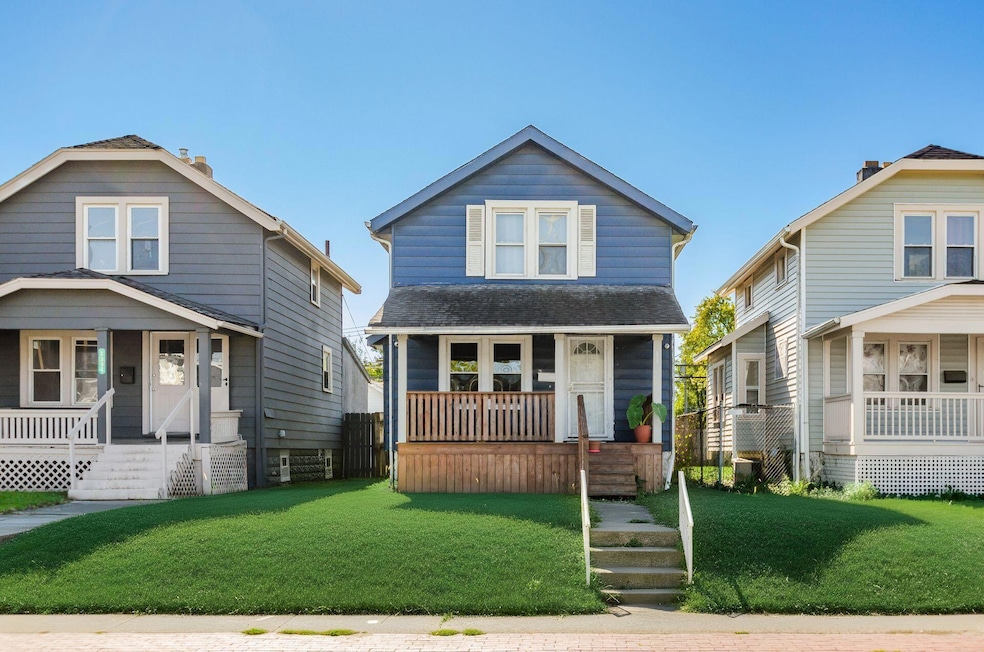
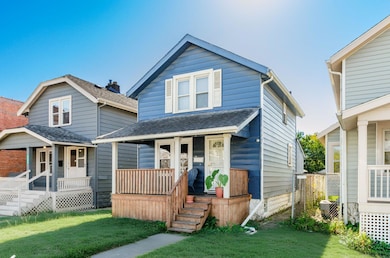
2397 Sullivant Ave Columbus, OH 43204
South Central Hilltop NeighborhoodEstimated payment $894/month
Highlights
- No HOA
- 1 Car Detached Garage
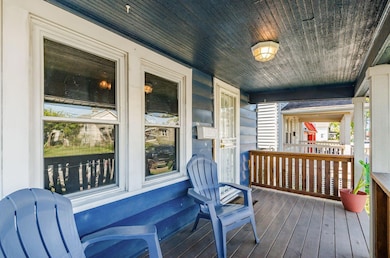
- Patio
- Fenced Yard
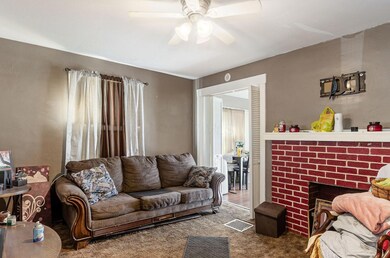
- Fireplace
- Forced Air Heating and Cooling System
About This Home
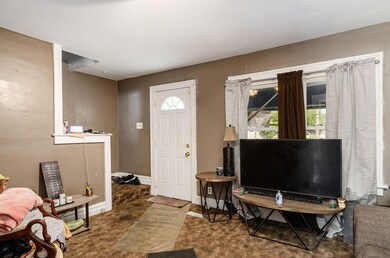
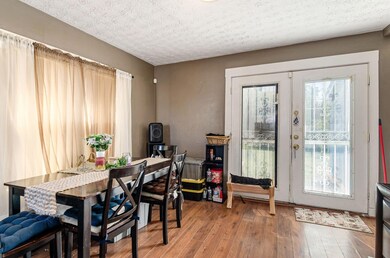
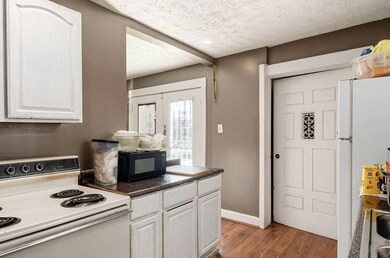
Welcome to this charming 2-bedroom, 1-bath home offering comfort, convenience, and great potential! Furnace and water tank are both NEW and electric panel has been recently updated as well. Whether you're looking for a cozy place to call your own or a smart addition to your rental portfolio, this property checks all the boxes.
The home features a practical layout with bright living spaces, a detached one-car garage, and a fenced backyard—perfect for pets, gardening, or relaxing outdoors. Located just minutes from downtown and Hollywood Casino, you'll enjoy easy access to shopping, dining, and entertainment. With its convenient location and versatile appeal, this home offers a fantastic opportunity for both first-time buyers and seasoned investors alike! HOME IS BEING SOLD ''AS IS.''
Home Details
Home Type
- Single Family
Est. Annual Taxes
- $1,728
Year Built
- Built in 1923
Lot Details
- 3,920 Sq Ft Lot
- Fenced Yard
Parking
- 1 Car Detached Garage
Home Design
- Block Foundation
- Vinyl Siding
Interior Spaces
- 984 Sq Ft Home
- 2-Story Property
- Fireplace
- Basement Fills Entire Space Under The House
- Electric Range
- Laundry on lower level
Flooring
- Carpet
- Laminate
Bedrooms and Bathrooms
- 2 Bedrooms
- 1 Full Bathroom
Outdoor Features
- Patio
Utilities
- Forced Air Heating and Cooling System
- Heating System Uses Gas
Community Details
- No Home Owners Association
Listing and Financial Details
- Assessor Parcel Number 010-020270
Map
Home Values in the Area
Average Home Value in this Area
Tax History
| Year | Tax Paid | Tax Assessment Tax Assessment Total Assessment is a certain percentage of the fair market value that is determined by local assessors to be the total taxable value of land and additions on the property. | Land | Improvement |
|---|---|---|---|---|
| 2024 | $4,290 | $31,860 | $3,820 | $28,040 |
| 2023 | $1,510 | $31,850 | $3,815 | $28,035 |
| 2022 | $1,481 | $14,670 | $1,750 | $12,920 |
| 2021 | $818 | $14,670 | $1,750 | $12,920 |
| 2020 | $918 | $14,670 | $1,750 | $12,920 |
| 2019 | $730 | $12,040 | $1,470 | $10,570 |
| 2018 | $688 | $12,040 | $1,470 | $10,570 |
| 2017 | $730 | $12,040 | $1,470 | $10,570 |
| 2016 | $712 | $10,750 | $2,980 | $7,770 |
| 2015 | $646 | $10,750 | $2,980 | $7,770 |
| 2014 | $648 | $10,750 | $2,980 | $7,770 |
| 2013 | $376 | $12,635 | $3,500 | $9,135 |
Property History
| Date | Event | Price | List to Sale | Price per Sq Ft |
|---|---|---|---|---|
| 11/02/2025 11/02/25 | Price Changed | $142,000 | -2.1% | $144 / Sq Ft |
| 10/15/2025 10/15/25 | For Sale | $145,000 | -- | $147 / Sq Ft |
Purchase History
| Date | Type | Sale Price | Title Company |
|---|---|---|---|
| Warranty Deed | $32,000 | Attorney | |
| Interfamily Deed Transfer | -- | -- | |
| Deed | $45,000 | -- | |
| Deed | $12,500 | -- | |
| Deed | $18,000 | -- |
Mortgage History
| Date | Status | Loan Amount | Loan Type |
|---|---|---|---|
| Open | $12,000 | Seller Take Back | |
| Previous Owner | $60,000 | New Conventional |
Source: Columbus and Central Ohio Regional MLS
MLS Number: 225038762
APN: 010-020270
Disclaimer: Certain information contained herein is derived from information provided by parties other than Homes.com. All information provided is deemed reliable, but is not guaranteed to be accurate and should be independently verified.
![]() IDX information is provided exclusively for personal, non-commercial use, and may not be used for any purpose other than to identify prospective properties consumers may be interested in purchasing.
IDX information is provided exclusively for personal, non-commercial use, and may not be used for any purpose other than to identify prospective properties consumers may be interested in purchasing.
Information is deemed reliable but not guaranteed.
- 558 S Oakley Ave Unit 60
- 426 S Eureka Ave
- 545-547 S Highland Ave Unit 545
- 471 S Terrace Ave Unit 473
- 2263 Shelton St
- 2264 Shelton St
- 540 S Richardson Ave
- 337 S Wayne Ave
- 349 S Eureka Ave
- 327-329 S Wayne Ave
- 321 S Oakley Ave
- 307 S Wheatland Ave
- 651 S Terrace Ave
- 693 S Wayne Ave
- 353 Clarendon Ave
- 304 S Highland Ave
- 379 Midland Ave
- 2188 Amherst Ave
- 724 S Eureka Ave
- 397 S Burgess Ave
- 432 S Highland Ave
- 367 S Wayne Ave
- 534 S Richardson Ave
- 478 S Richardson Ave Unit 2
- 661 S Eureka Ave
- 671-673-673 S Wheatland Ave Unit 671 S Wheatland
- 2171 Amherst Ave
- 587 S Ogden Ave
- 384 Whitethorne Ave
- 299 S Warren Ave
- 172 Whitethorne Ave
- 453 S Powell Ave
- 40 S Richardson Ave
- 2895 Sullivant Ave
- 947 Forest Creek Dr E
- 821 S Harris Ave
- 1965 Vaughn St Unit 1965 C
- 341 S Roys Ave
- 2085 W Broad St Unit 104
- 2085 W Broad St Unit 106
