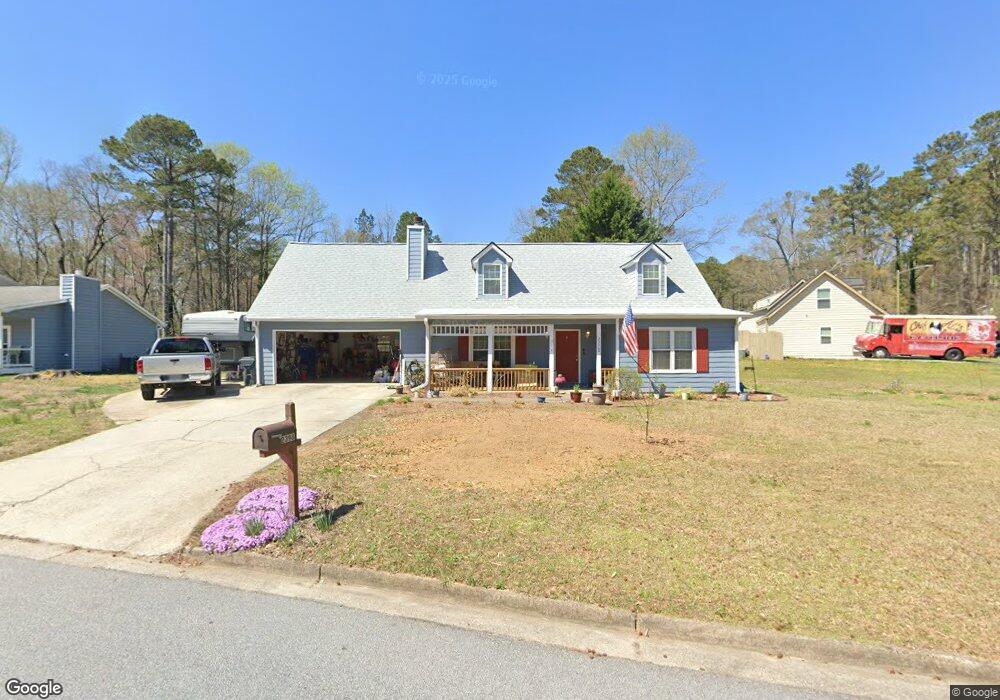
2398 Betsy Ct SW Unit 8 Marietta, GA 30008
Southwestern Marietta NeighborhoodEstimated Value: $317,000 - $368,826
3
Beds
2
Baths
1,823
Sq Ft
$183/Sq Ft
Est. Value
About This Home
This home is located at 2398 Betsy Ct SW Unit 8, Marietta, GA 30008 and is currently estimated at $334,457, approximately $183 per square foot. 2398 Betsy Ct SW Unit 8 is a home located in Cobb County with nearby schools including Dowell Elementary School, Smitha Middle School, and Osborne High School.
Ownership History
Date
Name
Owned For
Owner Type
Purchase Details
Closed on
Aug 18, 2005
Sold by
Vannorman Edward A
Bought by
Clayton Jenny L
Current Estimated Value
Home Financials for this Owner
Home Financials are based on the most recent Mortgage that was taken out on this home.
Original Mortgage
$153,885
Outstanding Balance
$80,070
Interest Rate
5.61%
Mortgage Type
New Conventional
Estimated Equity
$254,387
Purchase Details
Closed on
Jun 12, 2001
Sold by
Pmi Mtg Ins Co
Bought by
Vannorman Edward A
Home Financials for this Owner
Home Financials are based on the most recent Mortgage that was taken out on this home.
Original Mortgage
$128,520
Interest Rate
7.23%
Mortgage Type
VA
Purchase Details
Closed on
Feb 15, 2001
Sold by
Federal Home Loan Mortgage Corporation
Bought by
Pmi Mtg Ins Co
Purchase Details
Closed on
Sep 5, 2000
Sold by
Fairbanks Capital Corp
Bought by
Federal Home Loan Mortgage Corporation
Purchase Details
Closed on
Mar 22, 1996
Sold by
Akins Sidney W Tina
Bought by
Sloop Steven L
Create a Home Valuation Report for This Property
The Home Valuation Report is an in-depth analysis detailing your home's value as well as a comparison with similar homes in the area
Home Values in the Area
Average Home Value in this Area
Purchase History
| Date | Buyer | Sale Price | Title Company |
|---|---|---|---|
| Clayton Jenny L | $156,300 | -- | |
| Vannorman Edward A | $126,000 | -- | |
| Pmi Mtg Ins Co | -- | -- | |
| Federal Home Loan Mortgage Corporation | -- | -- | |
| Fairbank Capital Corp | $117,000 | -- | |
| Sloop Steven L | $108,000 | -- |
Source: Public Records
Mortgage History
| Date | Status | Borrower | Loan Amount |
|---|---|---|---|
| Open | Clayton Jenny L | $153,885 | |
| Previous Owner | Vannorman Edward A | $128,520 | |
| Closed | Sloop Steven L | $0 |
Source: Public Records
Tax History Compared to Growth
Tax History
| Year | Tax Paid | Tax Assessment Tax Assessment Total Assessment is a certain percentage of the fair market value that is determined by local assessors to be the total taxable value of land and additions on the property. | Land | Improvement |
|---|---|---|---|---|
| 2025 | $2,871 | $123,308 | $11,200 | $112,108 |
| 2024 | $2,873 | $123,308 | $11,200 | $112,108 |
| 2023 | $2,331 | $123,308 | $11,200 | $112,108 |
| 2022 | $2,365 | $99,036 | $8,800 | $90,236 |
| 2021 | $1,889 | $77,296 | $8,800 | $68,496 |
| 2020 | $1,889 | $77,296 | $8,800 | $68,496 |
| 2019 | $1,766 | $71,660 | $8,800 | $62,860 |
| 2018 | $1,341 | $53,188 | $8,800 | $44,388 |
| 2017 | $1,273 | $53,188 | $8,800 | $44,388 |
| 2016 | $1,140 | $48,532 | $8,800 | $39,732 |
| 2015 | $735 | $33,776 | $8,800 | $24,976 |
| 2014 | $522 | $26,400 | $0 | $0 |
Source: Public Records
Map
Nearby Homes
- 2379 Moseley Place SW
- 2381 Lakeside Place SW
- 2389 Jack Creek Rd SW
- 2615 Windage Dr SW
- 1226 Cumberland Creek Place SW
- 1104 Havel Dr SW
- 1697 Rustic Dr SW
- 2700 Flintlock Ln SW
- 1197 Woodleigh Rd SW
- 1345 Windage Ct SW Unit 6
- 1697 Dyeson Rd SW
- 1105 Woodleigh Rd SW
- 3075 Milford Chase SW
- 1951 Bergerac Ct SW
- 1308 Willamette Way
- 1086 Mornington Way
- 1405 Glynn Oaks Dr SW Unit 6
- 2400 Betsy Ct SW Unit 8
- 1401 Glynn Oaks Dr SW
- 1407 Glynn Oaks Dr SW
- 2401 Betsy Ct SW Unit 8
- 2402 Betsy Ct SW
- 2403 Betsy Ct SW
- 1400 Glynn Oaks Dr SW
- 1404 Glynn Oaks Dr SW
- 0 Glynn Oaks Dr SW Unit 8482589
- 0 Glynn Oaks Dr SW Unit 8375136
- 0 Glynn Oaks Dr SW Unit 8168817
- 0 Glynn Oaks Dr SW Unit 8052924
- 0 Glynn Oaks Dr SW Unit 8040776
- 0 Glynn Oaks Dr SW Unit 7617401
- 0 Glynn Oaks Dr SW Unit 7015860
- 0 Glynn Oaks Dr SW Unit 8982800
- 0 Glynn Oaks Dr SW Unit 9078902
- 0 Glynn Oaks Dr SW Unit 8754450
- 0 Glynn Oaks Dr SW Unit 3109464