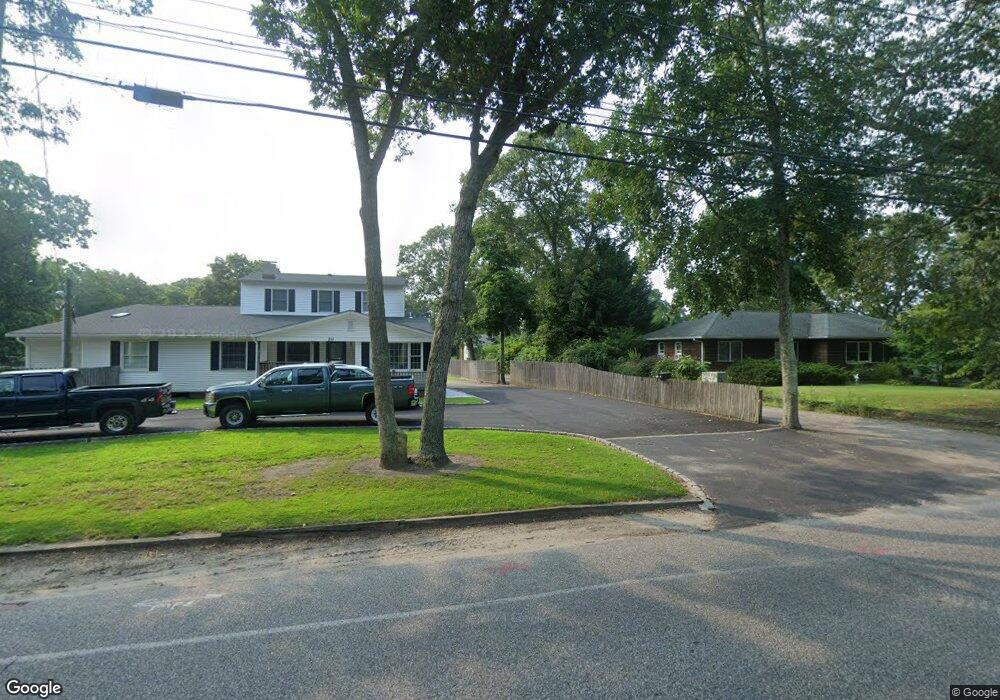
239B Hubbard Ave Riverhead, NY 11901
Estimated Value: $485,000 - $558,000
3
Beds
1
Bath
896
Sq Ft
$572/Sq Ft
Est. Value
About This Home
This home is located at 239B Hubbard Ave, Riverhead, NY 11901 and is currently estimated at $512,951, approximately $572 per square foot. 239B Hubbard Ave is a home located in Suffolk County with nearby schools including Pulaski Street Intermediate School, Riverhead Middle School, and Riverhead Senior High School.
Ownership History
Date
Name
Owned For
Owner Type
Purchase Details
Closed on
Sep 5, 2024
Sold by
Osterberg Richard T
Bought by
Reyes-Ochoa Roman L and Ramos Abraham T
Current Estimated Value
Home Financials for this Owner
Home Financials are based on the most recent Mortgage that was taken out on this home.
Original Mortgage
$490,943
Interest Rate
6.35%
Mortgage Type
FHA
Purchase Details
Closed on
Jun 15, 2015
Sold by
Hartill John and Hartill Diane
Bought by
Osterberg Richard T
Home Financials for this Owner
Home Financials are based on the most recent Mortgage that was taken out on this home.
Original Mortgage
$209,950
Interest Rate
3.84%
Mortgage Type
New Conventional
Purchase Details
Closed on
Jan 15, 2004
Sold by
Floege Charles and Floege Janet
Bought by
Hartill John and Hartill Diane
Create a Home Valuation Report for This Property
The Home Valuation Report is an in-depth analysis detailing your home's value as well as a comparison with similar homes in the area
Home Values in the Area
Average Home Value in this Area
Purchase History
| Date | Buyer | Sale Price | Title Company |
|---|---|---|---|
| Reyes-Ochoa Roman L | $500,000 | Titlevest Agency, Inc | |
| Reyes-Ochoa Roman L | $500,000 | Titlevest Agency, Inc | |
| Reyes-Ochoa Roman L | $500,000 | None Available | |
| Reyes-Ochoa Roman L | $500,000 | None Available | |
| Osterberg Richard T | $221,000 | Fidelity National Title | |
| Osterberg Richard T | $221,000 | Fidelity National Title | |
| Hartill John | $205,000 | -- | |
| Hartill John | $205,000 | -- |
Source: Public Records
Mortgage History
| Date | Status | Borrower | Loan Amount |
|---|---|---|---|
| Previous Owner | Reyes-Ochoa Roman L | $490,943 | |
| Previous Owner | Osterberg Richard T | $209,950 |
Source: Public Records
Tax History
| Year | Tax Paid | Tax Assessment Tax Assessment Total Assessment is a certain percentage of the fair market value that is determined by local assessors to be the total taxable value of land and additions on the property. | Land | Improvement |
|---|---|---|---|---|
| 2024 | $6,220 | $29,400 | $6,500 | $22,900 |
| 2023 | $6,220 | $29,400 | $6,500 | $22,900 |
| 2022 | $5,388 | $29,400 | $6,500 | $22,900 |
| 2021 | $5,388 | $29,400 | $6,500 | $22,900 |
| 2020 | $5,768 | $29,400 | $6,500 | $22,900 |
| 2019 | $5,768 | $0 | $0 | $0 |
| 2018 | -- | $29,400 | $6,500 | $22,900 |
| 2017 | $5,636 | $29,400 | $6,500 | $22,900 |
| 2016 | $5,444 | $29,400 | $6,500 | $22,900 |
| 2015 | -- | $29,400 | $6,500 | $22,900 |
| 2014 | -- | $29,400 | $6,500 | $22,900 |
Source: Public Records
Map
Nearby Homes
- 25/58 NYS (52 Main Rd) Route
- 117 Trout Brook Ln
- 133 Trout Brook Ln
- 37 Hubbard Ave Unit 95
- 61 Fairway Ave
- 30 Fairway Ave
- 49 Sunrise Ave
- 18 Tyte Dr
- 29 Bell Ave
- 923 E Main St
- 72 Josica Dr
- 50 Strawberry Commons
- 70 Strawberry Commons
- 761 E Main St
- 250 Main Rd
- 118 Overlook Dr
- 660 Northville Turnpike
- 128 Priscilla Ave
- 630 Northville Turnpike
- 309 Fanning Blvd
- 239 Hubbard Ave
- 239 Hubbard Ave
- 239 Hubbard Ave Unit B
- 239A Hubbard Ave
- 239C Hubbard Ave
- 237D Hubbard Ave
- 244 Hubbard Ave
- 249 Hubbard Ave
- 251 Hubbard Ave
- 229B Hubbard Ave
- 229A Hubbard Ave
- 237C Hubbard Ave
- 237 Hubbard Ave Unit D
- 237 Hubbard Ave Unit C
- 226 Hubbard Ave
- 236 Hubbard Ave
- 229 Hubbard Ave
- 220 Hubbard Ave
- 219 Hubbard Ave
- 238 Hubbard Ave
Your Personal Tour Guide
Ask me questions while you tour the home.