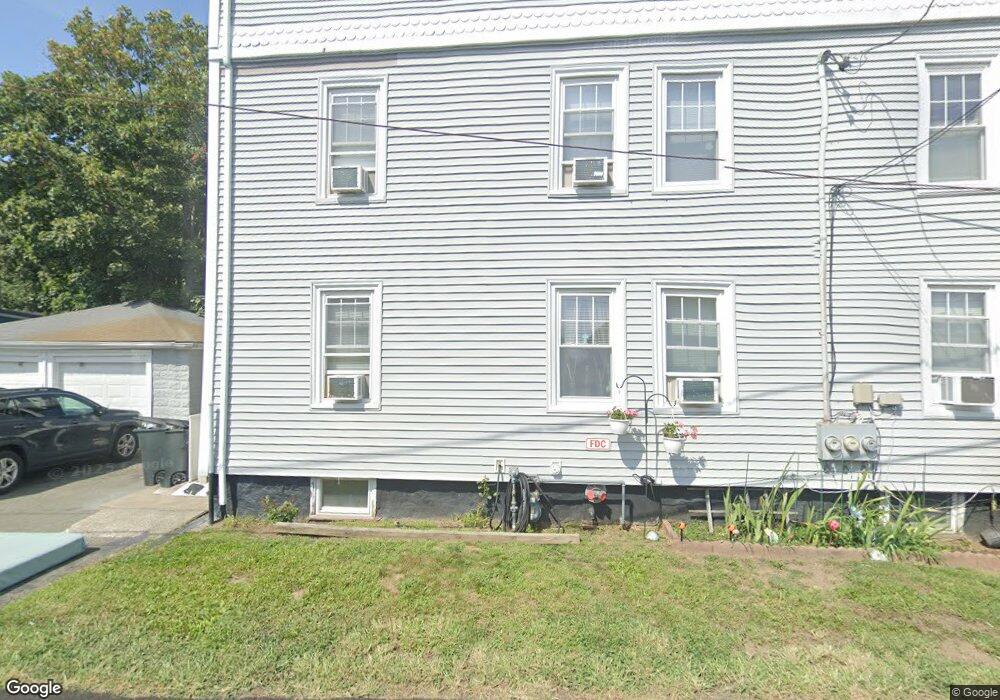
24-26 Claremont Ave Quincy, MA 02169
Quincy Point NeighborhoodEstimated Value: $906,174
12
Beds
4
Baths
4,256
Sq Ft
$213/Sq Ft
Est. Value
About This Home
This home is located at 24-26 Claremont Ave, Quincy, MA 02169 and is currently estimated at $906,174, approximately $212 per square foot. 24-26 Claremont Ave is a home located in Norfolk County with nearby schools including Point Webster Middle School, Clifford H. Marshall Elementary School, and Quincy High School.
Ownership History
Date
Name
Owned For
Owner Type
Purchase Details
Closed on
Nov 18, 2003
Sold by
Lawrence Rt and Stevens Lisa M
Bought by
Neighborhood Hsg Svcs
Current Estimated Value
Home Financials for this Owner
Home Financials are based on the most recent Mortgage that was taken out on this home.
Original Mortgage
$220,000
Outstanding Balance
$100,644
Interest Rate
5.81%
Mortgage Type
Commercial
Estimated Equity
$805,530
Create a Home Valuation Report for This Property
The Home Valuation Report is an in-depth analysis detailing your home's value as well as a comparison with similar homes in the area
Home Values in the Area
Average Home Value in this Area
Purchase History
| Date | Buyer | Sale Price | Title Company |
|---|---|---|---|
| Neighborhood Hsg Svcs | $430,000 | -- |
Source: Public Records
Mortgage History
| Date | Status | Borrower | Loan Amount |
|---|---|---|---|
| Open | Neighborhood Hsg Svcs | $220,000 |
Source: Public Records
Tax History Compared to Growth
Tax History
| Year | Tax Paid | Tax Assessment Tax Assessment Total Assessment is a certain percentage of the fair market value that is determined by local assessors to be the total taxable value of land and additions on the property. | Land | Improvement |
|---|---|---|---|---|
| 2025 | $10,112 | $877,000 | $264,200 | $612,800 |
| 2024 | $9,884 | $877,000 | $251,600 | $625,400 |
| 2023 | $9,144 | $821,600 | $228,700 | $592,900 |
| 2022 | $9,441 | $788,100 | $207,900 | $580,200 |
| 2021 | $9,355 | $770,600 | $207,900 | $562,700 |
| 2020 | $9,144 | $735,600 | $196,100 | $539,500 |
| 2019 | $9,109 | $725,800 | $181,600 | $544,200 |
| 2018 | $10,373 | $777,600 | $165,100 | $612,500 |
| 2017 | $7,186 | $507,100 | $157,200 | $349,900 |
| 2016 | $7,127 | $496,300 | $142,900 | $353,400 |
| 2015 | $6,732 | $461,100 | $134,800 | $326,300 |
| 2014 | $6,365 | $428,300 | $134,800 | $293,500 |
Source: Public Records
Map
Nearby Homes
- 26 Lawrence St
- 41 Broadway
- 585 Washington St Unit model-1
- 585 Washington St Unit model-2
- 585 Washington St Unit model
- 934 Southern Artery Unit 109
- 62 Lawn Ave
- 25 5th Ave
- 16 Perley Place
- 200 Falls Blvd Unit B305
- 200 Falls Blvd Unit C308
- 19 Keyes St
- 161 Sumner St Unit 2
- 161 Sumner St Unit 4
- 15 Bower Rd Unit B5
- 15 Bower Rd Unit A2
- 15 Bower Rd Unit B2
- 25 W Howard St Unit D2
- 200 Cove Way Unit 614
- 51 Sumner St
- 21 Lawrence St
- 16 Claremont Ave
- 23 Claremont Ave
- 23 Claremont Ave Unit D
- 23 Claremont Ave
- 19 Claremont Ave
- 14 Claremont Ave
- 28 Lawrence St
- 15 Claremont Ave
- 15 Claremont Ave Unit 2
- 17 Claremont Ave
- 15 Claremont Ave Unit 1
- 17 Claremont Ave Unit 1
- 32 Lawrence St
- 10 Claremont Ave
- 36 Claremont Ave
- 9 Claremont Ave
- 486 South St
- 11 Claremont Ave
- 484 South St