24-38 83rd St Flushing, NY 11370
Jackson Heights NeighborhoodEstimated Value: $982,000 - $1,065,000
Studio
3
Baths
1,683
Sq Ft
$608/Sq Ft
Est. Value
About This Home
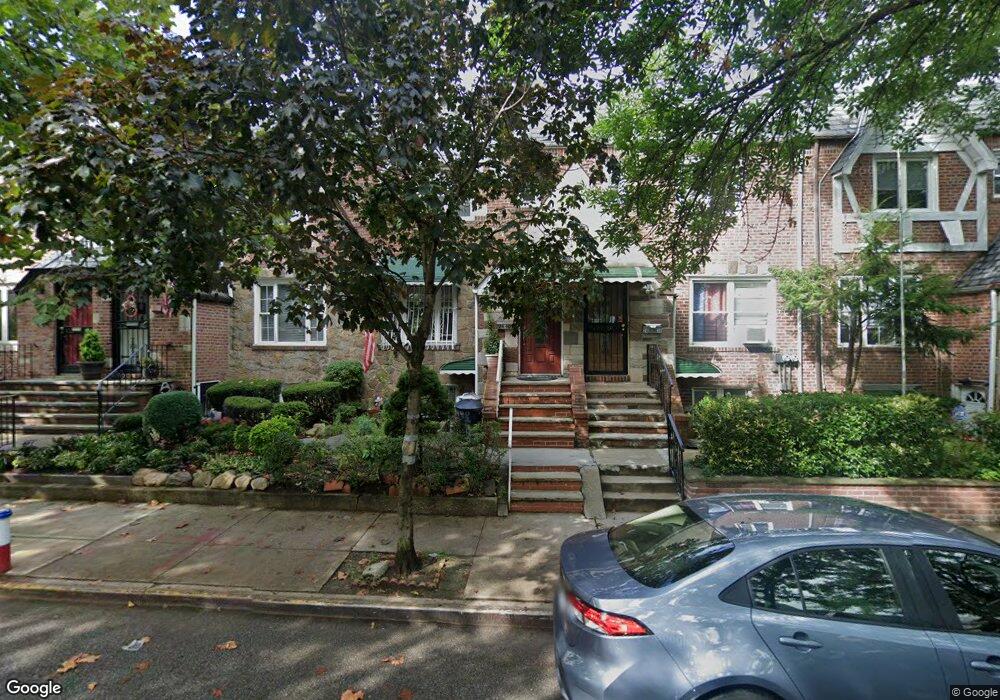
This home is located at 24-38 83rd St, Flushing, NY 11370 and is currently estimated at $1,024,070, approximately $608 per square foot. 24-38 83rd St is a home located in Queens County with nearby schools including P.S. 148, Is 141 The Steinway, and Newtown High School.
Ownership History
Date
Name
Owned For
Owner Type
Purchase Details
Closed on
Dec 12, 2019
Sold by
Doreste Soledad
Bought by
Akter Syed Shamima and Rahman Md Saifur
Current Estimated Value
Home Financials for this Owner
Home Financials are based on the most recent Mortgage that was taken out on this home.
Original Mortgage
$572,000
Outstanding Balance
$505,286
Interest Rate
3.7%
Mortgage Type
Purchase Money Mortgage
Estimated Equity
$518,784
Purchase Details
Closed on
Nov 5, 2013
Sold by
Gonzalez Soledad
Bought by
Doreste Soledad
Purchase Details
Closed on
Sep 24, 2008
Sold by
Gonzalez Jair and Gonzalez Soledad
Bought by
Gonzalez Soledad
Create a Home Valuation Report for This Property
The Home Valuation Report is an in-depth analysis detailing your home's value as well as a comparison with similar homes in the area
Home Values in the Area
Average Home Value in this Area
Purchase History
| Date | Buyer | Sale Price | Title Company |
|---|---|---|---|
| Akter Syed Shamima | $715,000 | -- | |
| Doreste Soledad | -- | -- | |
| Gonzalez Soledad | -- | -- |
Source: Public Records
Mortgage History
| Date | Status | Borrower | Loan Amount |
|---|---|---|---|
| Open | Akter Syed Shamima | $572,000 |
Source: Public Records
Tax History
| Year | Tax Paid | Tax Assessment Tax Assessment Total Assessment is a certain percentage of the fair market value that is determined by local assessors to be the total taxable value of land and additions on the property. | Land | Improvement |
|---|---|---|---|---|
| 2025 | $7,830 | $41,239 | $6,086 | $35,153 |
| 2024 | $7,830 | $38,983 | $5,484 | $33,499 |
| 2023 | $7,398 | $36,832 | $5,377 | $31,455 |
| 2022 | $7,009 | $50,340 | $8,820 | $41,520 |
| 2021 | $7,389 | $45,600 | $8,820 | $36,780 |
| 2020 | $7,274 | $50,100 | $8,820 | $41,280 |
| 2019 | $6,796 | $49,320 | $8,820 | $40,500 |
| 2018 | $6,257 | $30,693 | $7,792 | $22,901 |
| 2017 | $5,965 | $29,260 | $6,648 | $22,612 |
| 2016 | $5,849 | $29,260 | $6,648 | $22,612 |
| 2015 | $3,329 | $28,638 | $9,099 | $19,539 |
| 2014 | $3,329 | $27,072 | $9,490 | $17,582 |
Source: Public Records
Map
Nearby Homes
Your Personal Tour Guide
Ask me questions while you tour the home.