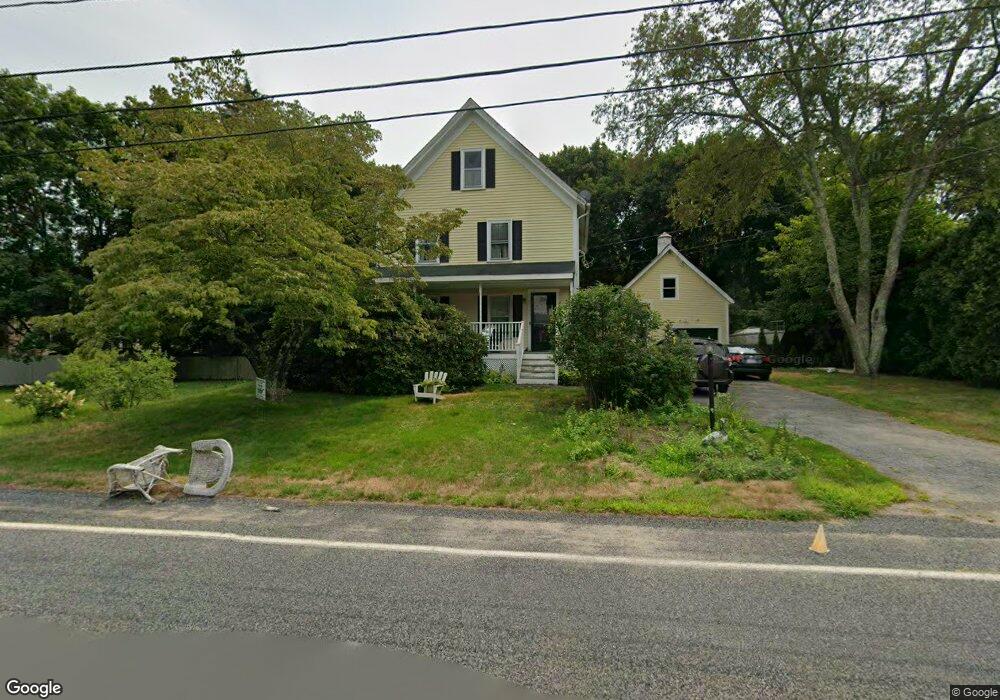
24 Balcom St Mansfield, MA 02048
Estimated Value: $657,085 - $737,000
3
Beds
2
Baths
2,232
Sq Ft
$312/Sq Ft
Est. Value
About This Home
This home is located at 24 Balcom St, Mansfield, MA 02048 and is currently estimated at $696,521, approximately $312 per square foot. 24 Balcom St is a home located in Bristol County with nearby schools including Everett W. Robinson Elementary School, Jordan/Jackson Elementary School, and Harold L. Qualters Middle School.
Ownership History
Date
Name
Owned For
Owner Type
Purchase Details
Closed on
Jun 27, 2019
Sold by
Orlando Barbara A
Bought by
Barbara A Orlando Lt and Orlando
Current Estimated Value
Purchase Details
Closed on
Jan 30, 2015
Sold by
Orlando Barbara A
Bought by
Mavrides Michael G
Create a Home Valuation Report for This Property
The Home Valuation Report is an in-depth analysis detailing your home's value as well as a comparison with similar homes in the area
Home Values in the Area
Average Home Value in this Area
Purchase History
| Date | Buyer | Sale Price | Title Company |
|---|---|---|---|
| Barbara A Orlando Lt | -- | -- | |
| Mavrides Michael G | $25,000 | -- |
Source: Public Records
Tax History
| Year | Tax Paid | Tax Assessment Tax Assessment Total Assessment is a certain percentage of the fair market value that is determined by local assessors to be the total taxable value of land and additions on the property. | Land | Improvement |
|---|---|---|---|---|
| 2025 | $7,182 | $545,300 | $234,500 | $310,800 |
| 2024 | $7,227 | $535,300 | $234,500 | $300,800 |
| 2023 | $6,953 | $493,500 | $234,500 | $259,000 |
| 2022 | $6,870 | $452,900 | $217,000 | $235,900 |
| 2021 | $3,283 | $424,900 | $190,000 | $234,900 |
| 2020 | $5,915 | $385,100 | $180,900 | $204,200 |
| 2019 | $5,808 | $381,600 | $150,700 | $230,900 |
| 2018 | $1,839 | $364,200 | $143,600 | $220,600 |
| 2017 | $5,346 | $355,900 | $139,400 | $216,500 |
| 2016 | $5,008 | $325,000 | $132,700 | $192,300 |
| 2015 | $4,786 | $308,800 | $132,700 | $176,100 |
Source: Public Records
Map
Nearby Homes
- 14 Claire Ave
- 44 Surrey Dr
- 85 Jewell St
- 2 Oak St Unit 2B
- 150 Gilbert St
- 451R Gilbert St
- 128 Tremont St
- 24 Maverick Dr
- 250 Mansfield Ave Unit 11
- 71 Richardson Ave
- 49 Pheasant Hill Rd
- 1769 West St
- 343 Godfrey Dr
- 143 Oak St Unit 10
- 101 Godfrey Dr Unit 101
- 10 Walter St
- 17 Childs Ln
- 25 Shepherd St
- 157 Mansfield Ave Unit 27
- 157 Mansfield Ave Unit 14
Your Personal Tour Guide
Ask me questions while you tour the home.