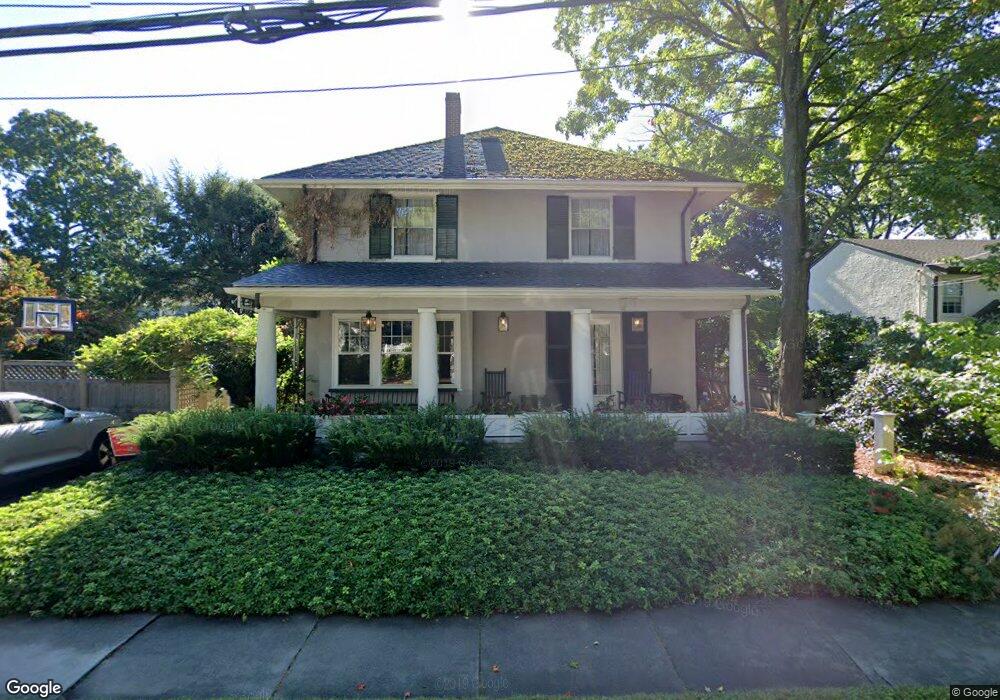
24 Central St Winchester, MA 01890
The Flats NeighborhoodEstimated Value: $2,008,393 - $2,423,000
4
Beds
4
Baths
3,986
Sq Ft
$577/Sq Ft
Est. Value
About This Home
This home is located at 24 Central St, Winchester, MA 01890 and is currently estimated at $2,300,598, approximately $577 per square foot. 24 Central St is a home located in Middlesex County with nearby schools including Ambrose Elementary School, McCall Middle School, and Winchester High School.
Ownership History
Date
Name
Owned For
Owner Type
Purchase Details
Closed on
Oct 12, 2010
Sold by
Jack B Howard Ft and Howard Carolyn B
Bought by
Bergstrom Donald A and Bergstrom Michelle L
Current Estimated Value
Home Financials for this Owner
Home Financials are based on the most recent Mortgage that was taken out on this home.
Original Mortgage
$880,000
Outstanding Balance
$579,023
Interest Rate
4.37%
Mortgage Type
Purchase Money Mortgage
Estimated Equity
$1,721,575
Purchase Details
Closed on
Sep 17, 2007
Sold by
Howard Carolyn B and Howard Jack B
Bought by
Jack B Howard Ft and Howard Jack B
Create a Home Valuation Report for This Property
The Home Valuation Report is an in-depth analysis detailing your home's value as well as a comparison with similar homes in the area
Home Values in the Area
Average Home Value in this Area
Purchase History
| Date | Buyer | Sale Price | Title Company |
|---|---|---|---|
| Bergstrom Donald A | $1,100,000 | -- | |
| Jack B Howard Ft | -- | -- |
Source: Public Records
Mortgage History
| Date | Status | Borrower | Loan Amount |
|---|---|---|---|
| Open | Bergstrom Donald A | $880,000 |
Source: Public Records
Tax History
| Year | Tax Paid | Tax Assessment Tax Assessment Total Assessment is a certain percentage of the fair market value that is determined by local assessors to be the total taxable value of land and additions on the property. | Land | Improvement |
|---|---|---|---|---|
| 2025 | $187 | $1,685,000 | $1,066,800 | $618,200 |
| 2024 | $18,178 | $1,604,400 | $1,035,400 | $569,000 |
| 2023 | $18,107 | $1,534,500 | $972,700 | $561,800 |
| 2022 | $17,645 | $1,410,500 | $878,500 | $532,000 |
| 2021 | $0 | $1,300,700 | $768,700 | $532,000 |
| 2020 | $16,116 | $1,300,700 | $768,700 | $532,000 |
| 2019 | $14,612 | $1,206,600 | $674,600 | $532,000 |
| 2018 | $0 | $1,176,000 | $658,900 | $517,100 |
| 2017 | $4,720 | $1,114,000 | $626,700 | $487,300 |
| 2016 | $12,839 | $1,099,200 | $626,700 | $472,500 |
| 2015 | $12,316 | $1,014,500 | $569,500 | $445,000 |
| 2014 | $11,995 | $947,500 | $517,700 | $429,800 |
Source: Public Records
Map
Nearby Homes
- 45 Bacon St
- 9 Lakeview Terrace
- 27 Everett Ave
- 10 Sheffield W
- 12 Yale St
- 6 Ivy Cir
- 20 Grove Place
- 2 Canterbury Rd
- 115 Washington St Unit 2A
- 61 Grove St
- 263 Highland Ave
- 25 Myopia Rd
- 17 Cranston Rd
- 13 Nelson St
- 6 Marchant Rd
- 49 Spruce St
- 9 Albamont Rd
- 89 Wildwood St
- 200 Swanton St Unit 228
- 200 Swanton St Unit 636
Your Personal Tour Guide
Ask me questions while you tour the home.