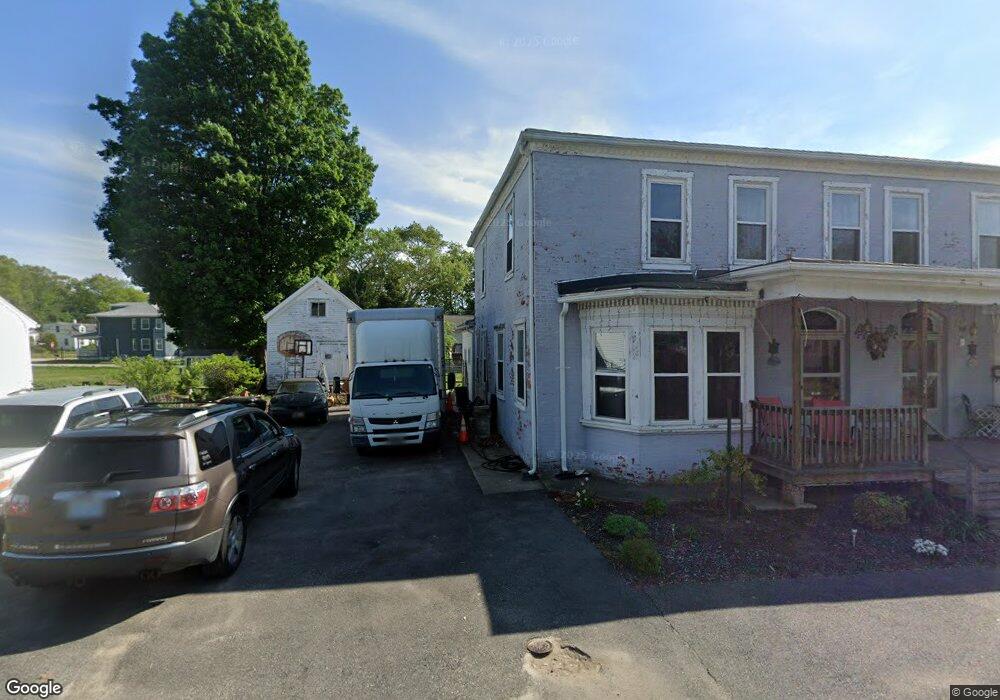
24 Charles St Cranston, RI 02920
Meshanticut NeighborhoodEstimated Value: $565,381 - $690,000
8
Beds
2
Baths
3,798
Sq Ft
$168/Sq Ft
Est. Value
About This Home
This home is located at 24 Charles St, Cranston, RI 02920 and is currently estimated at $639,845, approximately $168 per square foot. 24 Charles St is a home located in Providence County with nearby schools including George J. Peters School, Western Hills Middle School, and Cranston High School West.
Ownership History
Date
Name
Owned For
Owner Type
Purchase Details
Closed on
Nov 2, 1995
Sold by
Stsauveur John A and Stsauveur Gerilyn
Bought by
Brown Mary A
Current Estimated Value
Home Financials for this Owner
Home Financials are based on the most recent Mortgage that was taken out on this home.
Original Mortgage
$150,000
Interest Rate
7.58%
Create a Home Valuation Report for This Property
The Home Valuation Report is an in-depth analysis detailing your home's value as well as a comparison with similar homes in the area
Home Values in the Area
Average Home Value in this Area
Purchase History
| Date | Buyer | Sale Price | Title Company |
|---|---|---|---|
| Brown Mary A | $150,000 | -- |
Source: Public Records
Mortgage History
| Date | Status | Borrower | Loan Amount |
|---|---|---|---|
| Open | Brown Mary A | $272,000 | |
| Closed | Brown Mary A | $138,910 | |
| Closed | Brown Mary A | $150,000 |
Source: Public Records
Tax History
| Year | Tax Paid | Tax Assessment Tax Assessment Total Assessment is a certain percentage of the fair market value that is determined by local assessors to be the total taxable value of land and additions on the property. | Land | Improvement |
|---|---|---|---|---|
| 2025 | $5,877 | $423,400 | $99,100 | $324,300 |
| 2024 | $5,762 | $423,400 | $99,100 | $324,300 |
| 2023 | $5,857 | $309,900 | $65,300 | $244,600 |
| 2022 | $5,736 | $309,900 | $65,300 | $244,600 |
| 2021 | $5,578 | $309,900 | $65,300 | $244,600 |
| 2020 | $5,463 | $263,000 | $62,200 | $200,800 |
| 2019 | $5,463 | $263,000 | $62,200 | $200,800 |
| 2018 | $5,336 | $263,000 | $62,200 | $200,800 |
| 2017 | $4,916 | $214,300 | $55,900 | $158,400 |
| 2016 | $4,811 | $214,300 | $55,900 | $158,400 |
| 2015 | $4,811 | $214,300 | $55,900 | $158,400 |
| 2014 | $5,217 | $228,400 | $55,900 | $172,500 |
Source: Public Records
Map
Nearby Homes
- 333 Phenix Ave
- 140 Lake View Rd
- 58 Meredith Dr
- 69 W View Ave
- 99 Salem Ave
- 80 W View Ave
- 214 Meshanticut Valley Pkwy
- 129 Vallette St
- 84 N View Ave
- 141 Glen Ridge Rd
- 29 Valley St
- 178 Highland St
- 19 Salem Ave
- 203 Dean Ridge Ct
- 275 Meshanticut Valley Pkwy
- 242 Brettonwoods Dr
- 7 Oak Tree Ln
- 89R Randall St
- 00 Burton St
- 54 Randall St
Your Personal Tour Guide
Ask me questions while you tour the home.