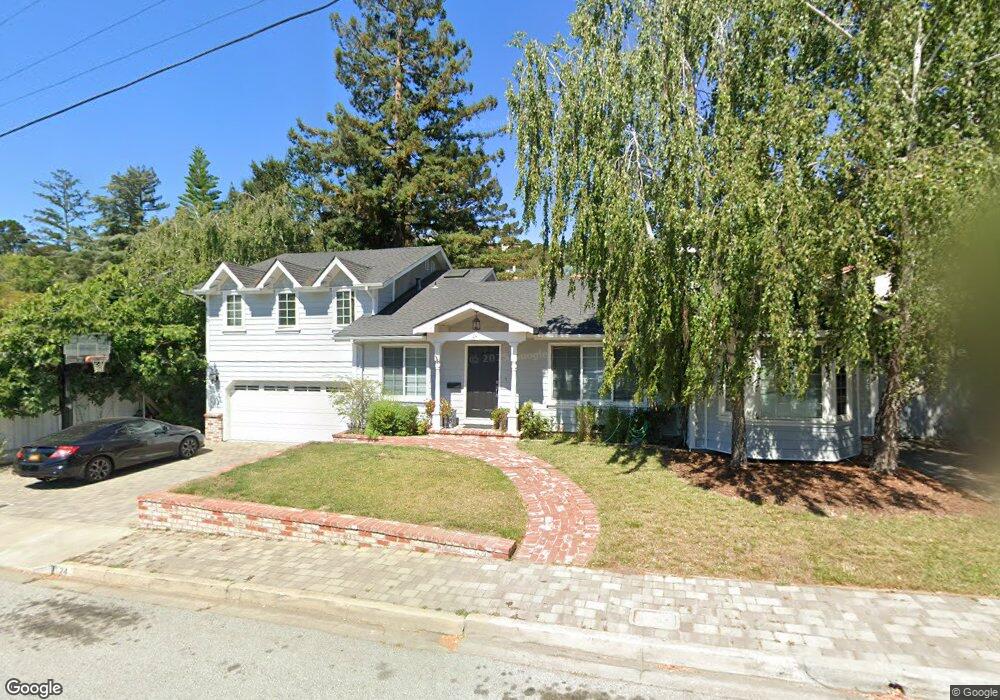
24 Charlton St San Carlos, CA 94070
Beverly Terrace NeighborhoodEstimated Value: $1,961,000 - $2,674,000
4
Beds
2
Baths
2,090
Sq Ft
$1,147/Sq Ft
Est. Value
About This Home
This home is located at 24 Charlton St, San Carlos, CA 94070 and is currently estimated at $2,397,204, approximately $1,146 per square foot. 24 Charlton St is a home located in San Mateo County with nearby schools including Arundel Elementary School, Tierra Linda Middle School, and Carlmont High School.
Ownership History
Date
Name
Owned For
Owner Type
Purchase Details
Closed on
Mar 11, 2019
Sold by
Hobbs Drek M and Hobbs Amy E
Bought by
Hobbs Derek M and Hobbs Amy E
Current Estimated Value
Home Financials for this Owner
Home Financials are based on the most recent Mortgage that was taken out on this home.
Original Mortgage
$200,000
Outstanding Balance
$166,747
Interest Rate
4.4%
Mortgage Type
Credit Line Revolving
Estimated Equity
$2,230,457
Purchase Details
Closed on
Aug 18, 2016
Sold by
Hobbs Derek M and Hobbs Amy E
Bought by
Hobbs Derek M and Hobbs Amy E
Purchase Details
Closed on
Jul 11, 1997
Sold by
Wickers Robert J and Wickers Karen C
Bought by
Hobbs Derek M and Hobbs Amy E
Home Financials for this Owner
Home Financials are based on the most recent Mortgage that was taken out on this home.
Original Mortgage
$280,000
Interest Rate
7.7%
Create a Home Valuation Report for This Property
The Home Valuation Report is an in-depth analysis detailing your home's value as well as a comparison with similar homes in the area
Home Values in the Area
Average Home Value in this Area
Purchase History
| Date | Buyer | Sale Price | Title Company |
|---|---|---|---|
| Hobbs Derek M | -- | Chicago Title Company | |
| Hobbs Derek M | -- | Chicago Title Company | |
| Hobbs Derek M | -- | None Available | |
| Hobbs Derek M | $350,000 | Fidelity National Title Co |
Source: Public Records
Mortgage History
| Date | Status | Borrower | Loan Amount |
|---|---|---|---|
| Open | Hobbs Derek M | $200,000 | |
| Closed | Hobbs Derek M | $280,000 |
Source: Public Records
Tax History Compared to Growth
Tax History
| Year | Tax Paid | Tax Assessment Tax Assessment Total Assessment is a certain percentage of the fair market value that is determined by local assessors to be the total taxable value of land and additions on the property. | Land | Improvement |
|---|---|---|---|---|
| 2025 | $9,214 | $666,419 | $279,421 | $386,998 |
| 2023 | $9,214 | $640,544 | $268,572 | $371,972 |
| 2022 | $8,700 | $627,985 | $263,306 | $364,679 |
| 2021 | $8,562 | $615,674 | $258,144 | $357,530 |
| 2020 | $8,452 | $609,363 | $255,498 | $353,865 |
| 2019 | $8,255 | $597,417 | $250,489 | $346,928 |
| 2018 | $8,033 | $585,705 | $245,578 | $340,127 |
| 2017 | $7,913 | $574,222 | $240,763 | $333,459 |
| 2016 | $7,654 | $562,965 | $236,043 | $326,922 |
| 2015 | $7,629 | $554,510 | $232,498 | $322,012 |
| 2014 | $7,357 | $543,649 | $227,944 | $315,705 |
Source: Public Records
Map
Nearby Homes
- 108 Beverly Dr
- 28 Kirkwood Way
- 0 Devonshire Blvd
- 162 Coronado Ave
- 000 Devonshire Blvd
- 38 Sequoia Ct
- 151 Highland Ave
- 88 Madera Ave
- 90 Gateway Ct
- 65 Madera Ave
- 140 Northam Ave
- 21 Highland Ave
- 46 Arch Ln
- 53 Madera Ave
- 10 Winding Way
- 222 Oakley Ave
- 39 Madera Ave
- 141 Hillcrest Rd
- 241 Shelford Ave
- 400 Winding Way