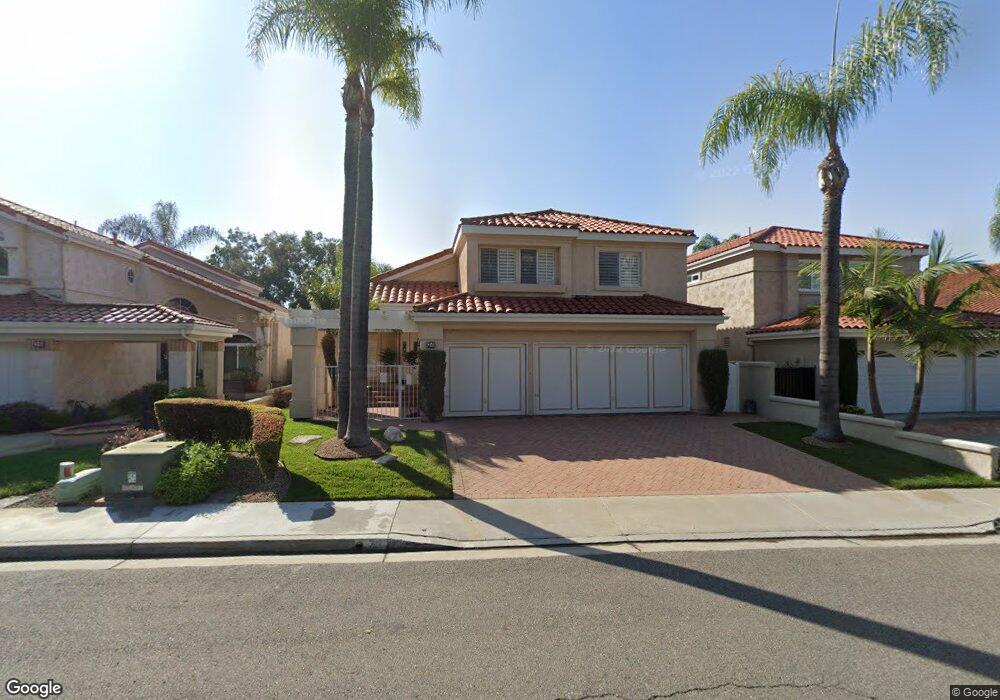
24 Corsica Laguna Niguel, CA 92677
Marina Hills NeighborhoodEstimated Value: $1,660,000 - $1,836,000
4
Beds
3
Baths
2,149
Sq Ft
$809/Sq Ft
Est. Value
About This Home
This home is located at 24 Corsica, Laguna Niguel, CA 92677 and is currently estimated at $1,739,510, approximately $809 per square foot. 24 Corsica is a home located in Orange County with nearby schools including Hidden Hills Elementary, Niguel Hills Middle School, and Dana Hills High School.
Ownership History
Date
Name
Owned For
Owner Type
Purchase Details
Closed on
Jun 16, 2025
Sold by
Pecile-Peteani Family Trust and Pecile-Peteani Sheila
Bought by
Lancona Real Estate Group Inc
Current Estimated Value
Home Financials for this Owner
Home Financials are based on the most recent Mortgage that was taken out on this home.
Original Mortgage
$1,160,000
Interest Rate
6.75%
Mortgage Type
New Conventional
Purchase Details
Closed on
Sep 4, 2018
Sold by
Peteani Sheila Pecile
Bought by
Peteani Sheila Pecile and The Pecile Peteani Family Trst
Create a Home Valuation Report for This Property
The Home Valuation Report is an in-depth analysis detailing your home's value as well as a comparison with similar homes in the area
Home Values in the Area
Average Home Value in this Area
Purchase History
| Date | Buyer | Sale Price | Title Company |
|---|---|---|---|
| Lancona Real Estate Group Inc | $1,450,000 | Lawyers Title Company | |
| Peteani Sheila Pecile | -- | Fnc Title Svcs Llc |
Source: Public Records
Mortgage History
| Date | Status | Borrower | Loan Amount |
|---|---|---|---|
| Previous Owner | Lancona Real Estate Group Inc | $1,160,000 |
Source: Public Records
Tax History Compared to Growth
Tax History
| Year | Tax Paid | Tax Assessment Tax Assessment Total Assessment is a certain percentage of the fair market value that is determined by local assessors to be the total taxable value of land and additions on the property. | Land | Improvement |
|---|---|---|---|---|
| 2025 | $5,348 | $544,352 | $208,741 | $335,611 |
| 2024 | $5,348 | $533,679 | $204,648 | $329,031 |
| 2023 | $5,233 | $523,215 | $200,635 | $322,580 |
| 2022 | $5,133 | $512,956 | $196,701 | $316,255 |
| 2021 | $5,032 | $502,899 | $192,845 | $310,054 |
| 2020 | $4,981 | $497,743 | $190,868 | $306,875 |
| 2019 | $4,882 | $487,984 | $187,126 | $300,858 |
| 2018 | $4,787 | $478,416 | $183,457 | $294,959 |
| 2017 | $4,692 | $469,036 | $179,860 | $289,176 |
| 2016 | $4,601 | $459,840 | $176,334 | $283,506 |
| 2015 | $4,531 | $452,933 | $173,685 | $279,248 |
| 2014 | $4,442 | $444,061 | $170,283 | $273,778 |
Source: Public Records
Map
Nearby Homes