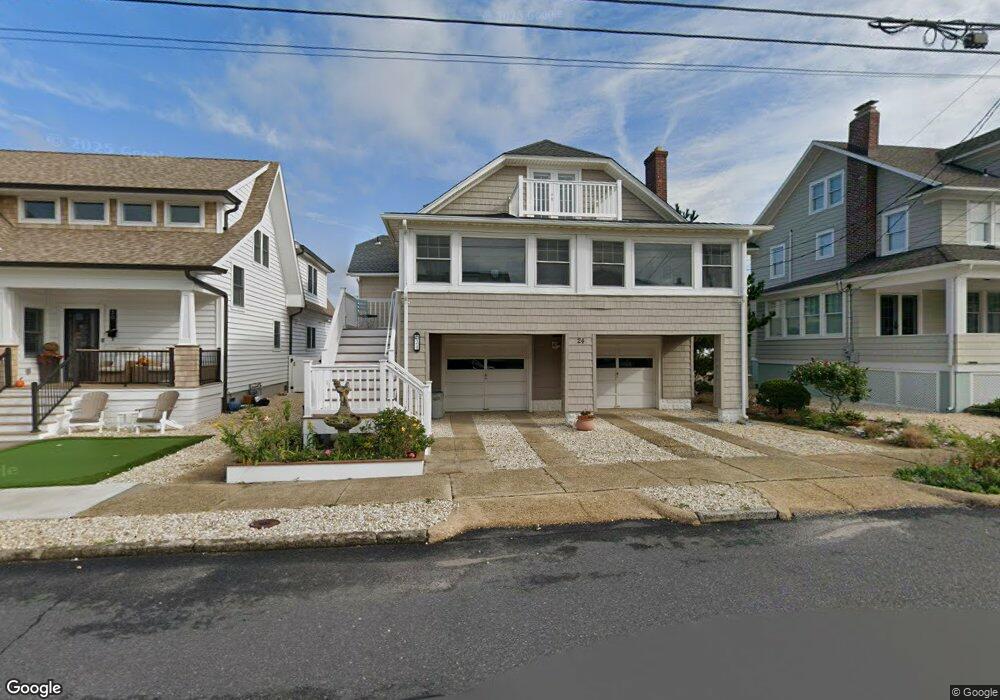
24 D St Seaside Park, NJ 08752
Estimated Value: $970,000 - $1,757,000
3
Beds
3
Baths
2,712
Sq Ft
$527/Sq Ft
Est. Value
About This Home
This home is located at 24 D St, Seaside Park, NJ 08752 and is currently estimated at $1,429,585, approximately $527 per square foot. 24 D St is a home located in Ocean County with nearby schools including Central Regional Middle School and Central Regional High School.
Ownership History
Date
Name
Owned For
Owner Type
Purchase Details
Closed on
Dec 15, 2021
Sold by
Maggio Barbara A
Bought by
2021 Barbara A Fratangelo Revocable Living Tr
Current Estimated Value
Purchase Details
Closed on
Dec 14, 1994
Sold by
Floriani Frank
Bought by
Maggio Barbara A and D'Auria Joanne
Home Financials for this Owner
Home Financials are based on the most recent Mortgage that was taken out on this home.
Original Mortgage
$75,000
Interest Rate
9.03%
Create a Home Valuation Report for This Property
The Home Valuation Report is an in-depth analysis detailing your home's value as well as a comparison with similar homes in the area
Home Values in the Area
Average Home Value in this Area
Purchase History
| Date | Buyer | Sale Price | Title Company |
|---|---|---|---|
| 2021 Barbara A Fratangelo Revocable Living Tr | -- | Busch Allison J | |
| 2021 Barbara A Fratangelo Revocable Living Tr | -- | None Listed On Document | |
| Maggio Barbara A | $210,000 | -- |
Source: Public Records
Mortgage History
| Date | Status | Borrower | Loan Amount |
|---|---|---|---|
| Previous Owner | Maggio Barbara A | $75,000 |
Source: Public Records
Tax History Compared to Growth
Tax History
| Year | Tax Paid | Tax Assessment Tax Assessment Total Assessment is a certain percentage of the fair market value that is determined by local assessors to be the total taxable value of land and additions on the property. | Land | Improvement |
|---|---|---|---|---|
| 2025 | $11,725 | $716,700 | $550,000 | $166,700 |
| 2024 | $11,532 | $716,700 | $550,000 | $166,700 |
| 2023 | $11,123 | $716,700 | $550,000 | $166,700 |
| 2022 | $11,123 | $716,700 | $550,000 | $166,700 |
| 2021 | $10,887 | $716,700 | $550,000 | $166,700 |
| 2020 | $10,772 | $716,700 | $550,000 | $166,700 |
| 2019 | $10,657 | $716,700 | $550,000 | $166,700 |
| 2018 | $9,962 | $716,700 | $550,000 | $166,700 |
| 2017 | $10,113 | $716,700 | $550,000 | $166,700 |
| 2016 | $9,403 | $716,700 | $550,000 | $166,700 |
| 2015 | $9,812 | $716,700 | $550,000 | $166,700 |
| 2014 | $9,374 | $716,700 | $550,000 | $166,700 |
Source: Public Records
Map
Nearby Homes