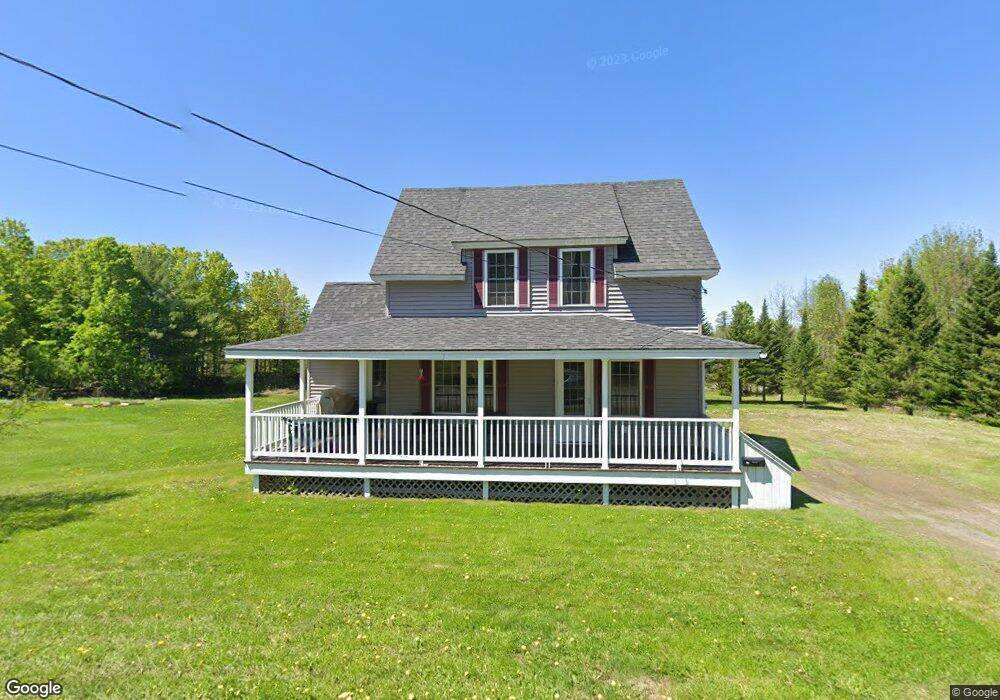
24 Davis St Dover Foxcroft, ME 04426
Estimated Value: $162,000 - $275,000
2
Beds
2
Baths
911
Sq Ft
$234/Sq Ft
Est. Value
About This Home
This home is located at 24 Davis St, Dover Foxcroft, ME 04426 and is currently estimated at $213,233, approximately $234 per square foot. 24 Davis St is a home with nearby schools including Se Do Mo Cha Elementary School, Se Do Mo Cha Middle School, and Foxcroft Academy.
Ownership History
Date
Name
Owned For
Owner Type
Purchase Details
Closed on
Jun 10, 2015
Sold by
Arno Stephen A
Bought by
Rizzitello Angelo and Rizzitello Rose M
Current Estimated Value
Home Financials for this Owner
Home Financials are based on the most recent Mortgage that was taken out on this home.
Original Mortgage
$98,940
Outstanding Balance
$76,357
Interest Rate
3.65%
Mortgage Type
New Conventional
Estimated Equity
$136,876
Purchase Details
Closed on
Jan 11, 2006
Sold by
Dover Foxcroft Town Of
Bought by
Arno Stephen A
Create a Home Valuation Report for This Property
The Home Valuation Report is an in-depth analysis detailing your home's value as well as a comparison with similar homes in the area
Home Values in the Area
Average Home Value in this Area
Purchase History
| Date | Buyer | Sale Price | Title Company |
|---|---|---|---|
| Rizzitello Angelo | -- | -- | |
| Arno Stephen A | -- | -- |
Source: Public Records
Mortgage History
| Date | Status | Borrower | Loan Amount |
|---|---|---|---|
| Open | Rizzitello Angelo | $98,940 |
Source: Public Records
Tax History Compared to Growth
Tax History
| Year | Tax Paid | Tax Assessment Tax Assessment Total Assessment is a certain percentage of the fair market value that is determined by local assessors to be the total taxable value of land and additions on the property. | Land | Improvement |
|---|---|---|---|---|
| 2024 | $2,098 | $123,400 | $15,500 | $107,900 |
| 2023 | $1,872 | $100,900 | $14,300 | $86,600 |
| 2022 | $1,766 | $88,300 | $13,100 | $75,200 |
| 2021 | $1,780 | $82,800 | $11,900 | $70,900 |
| 2020 | $1,772 | $82,800 | $11,900 | $70,900 |
| 2019 | $1,765 | $82,100 | $11,900 | $70,200 |
| 2018 | $1,741 | $82,100 | $11,900 | $70,200 |
| 2017 | $1,716 | $82,100 | $11,900 | $70,200 |
| 2016 | $1,663 | $82,100 | $11,900 | $70,200 |
| 2015 | $1,527 | $82,100 | $11,900 | $70,200 |
| 2014 | $1,498 | $82,100 | $11,900 | $70,200 |
| 2013 | $1,449 | $82,100 | $11,900 | $70,200 |
Source: Public Records
Map
Nearby Homes