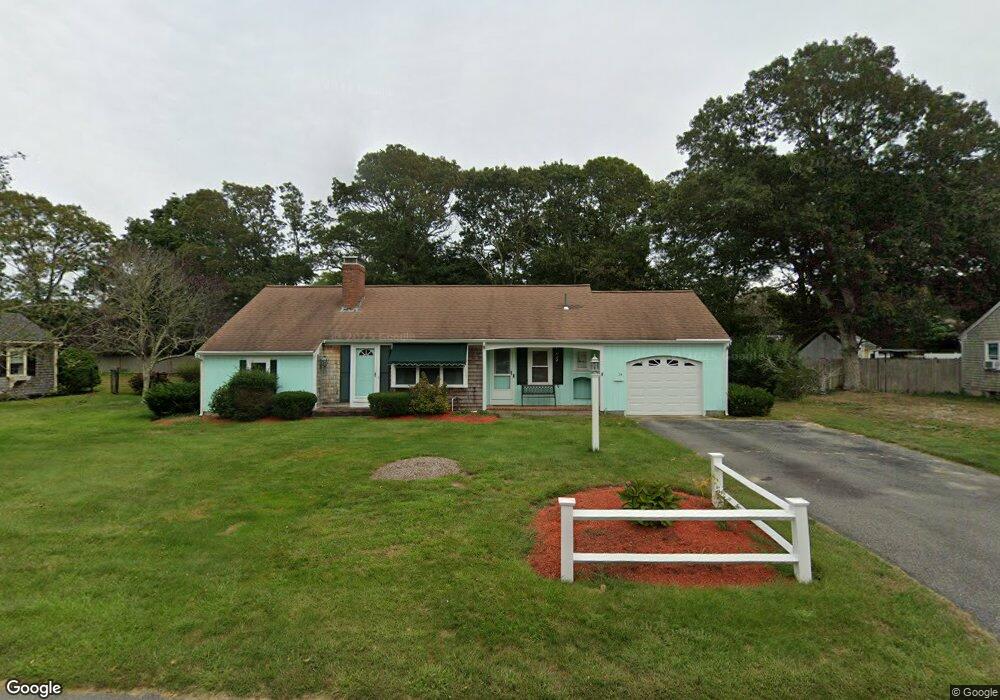
24 Deacon St South Yarmouth, MA 02664
Estimated Value: $563,000 - $594,000
2
Beds
2
Baths
1,001
Sq Ft
$572/Sq Ft
Est. Value
About This Home
This home is located at 24 Deacon St, South Yarmouth, MA 02664 and is currently estimated at $573,038, approximately $572 per square foot. 24 Deacon St is a home located in Barnstable County with nearby schools including Dennis-Yarmouth Regional High School and St. Pius X. School.
Ownership History
Date
Name
Owned For
Owner Type
Purchase Details
Closed on
Sep 8, 2003
Sold by
Mager Kathleen M
Bought by
Fife Robert and Fife Sandra L
Current Estimated Value
Purchase Details
Closed on
Jul 28, 1995
Sold by
Currie Darrel B and Currie Charlotte I
Bought by
Duffy Dianne M
Home Financials for this Owner
Home Financials are based on the most recent Mortgage that was taken out on this home.
Original Mortgage
$99,750
Interest Rate
7.56%
Mortgage Type
Purchase Money Mortgage
Create a Home Valuation Report for This Property
The Home Valuation Report is an in-depth analysis detailing your home's value as well as a comparison with similar homes in the area
Home Values in the Area
Average Home Value in this Area
Purchase History
| Date | Buyer | Sale Price | Title Company |
|---|---|---|---|
| Fife Robert | $245,000 | -- | |
| Duffy Dianne M | $105,000 | -- |
Source: Public Records
Mortgage History
| Date | Status | Borrower | Loan Amount |
|---|---|---|---|
| Previous Owner | Duffy Dianne M | $115,200 | |
| Previous Owner | Duffy Dianne M | $25,000 | |
| Previous Owner | Duffy Dianne M | $116,000 | |
| Previous Owner | Duffy Dianne M | $99,750 |
Source: Public Records
Tax History Compared to Growth
Tax History
| Year | Tax Paid | Tax Assessment Tax Assessment Total Assessment is a certain percentage of the fair market value that is determined by local assessors to be the total taxable value of land and additions on the property. | Land | Improvement |
|---|---|---|---|---|
| 2025 | $3,512 | $496,100 | $179,300 | $316,800 |
| 2024 | $3,269 | $443,000 | $151,600 | $291,400 |
| 2023 | $3,166 | $390,400 | $131,200 | $259,200 |
| 2022 | $2,997 | $326,500 | $119,300 | $207,200 |
| 2021 | $2,825 | $295,500 | $119,300 | $176,200 |
| 2020 | $2,769 | $276,900 | $119,300 | $157,600 |
| 2019 | $2,571 | $254,600 | $119,300 | $135,300 |
| 2018 | $2,438 | $236,900 | $101,600 | $135,300 |
| 2017 | $2,330 | $232,500 | $97,200 | $135,300 |
| 2016 | $2,232 | $223,600 | $88,300 | $135,300 |
| 2015 | $2,197 | $218,800 | $88,300 | $130,500 |
Source: Public Records
Map
Nearby Homes