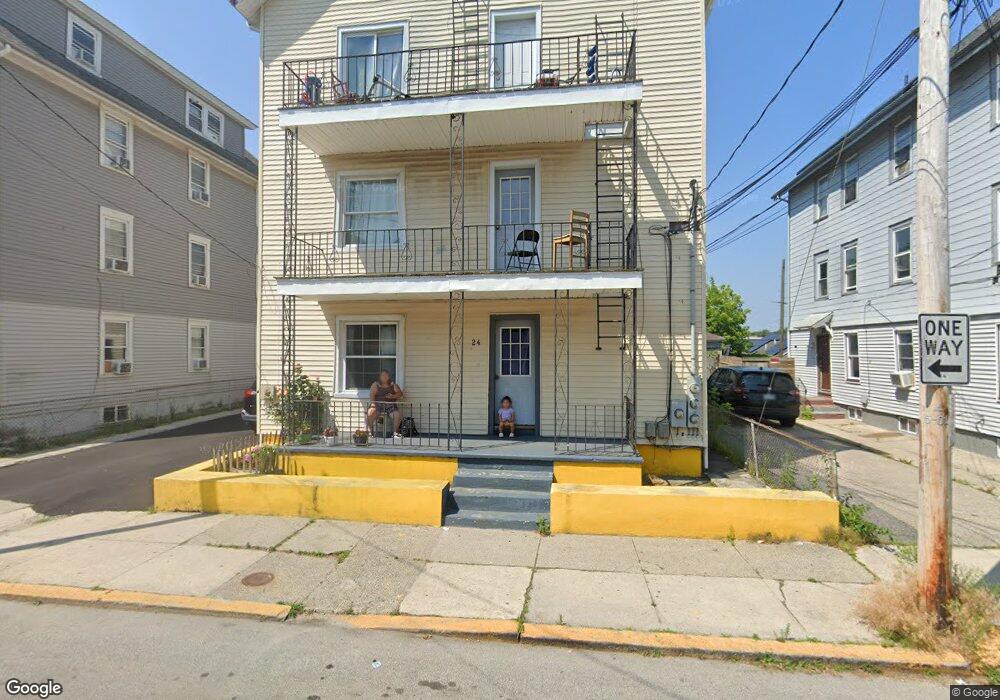
24 Fletcher St Central Falls, RI 02863
12
Beds
4
Baths
3,724
Sq Ft
4,792
Sq Ft Lot
About This Home
This home is located at 24 Fletcher St, Central Falls, RI 02863. 24 Fletcher St is a home located in Providence County with nearby schools including Central Falls Senior High School, Blackstone Valley Prep Elementary School 2, and Blackstone Valley Prep Junior High School.
Ownership History
Date
Name
Owned For
Owner Type
Purchase Details
Closed on
Apr 29, 2022
Sold by
Barros Madueno
Bought by
Borges Antonio
Home Financials for this Owner
Home Financials are based on the most recent Mortgage that was taken out on this home.
Original Mortgage
$476,215
Outstanding Balance
$443,024
Interest Rate
4.16%
Mortgage Type
FHA
Purchase Details
Closed on
Sep 3, 2013
Sold by
Barros Madueno
Bought by
White Karolyn
Home Financials for this Owner
Home Financials are based on the most recent Mortgage that was taken out on this home.
Original Mortgage
$40,000
Interest Rate
4.4%
Mortgage Type
New Conventional
Purchase Details
Closed on
Sep 2, 2013
Sold by
White Karolye
Bought by
Barros Madueno
Home Financials for this Owner
Home Financials are based on the most recent Mortgage that was taken out on this home.
Original Mortgage
$40,000
Interest Rate
4.4%
Mortgage Type
New Conventional
Purchase Details
Closed on
May 23, 2013
Sold by
Perez Luis and Narragansett Bay Commi
Bought by
Perez Luis and Negron Ramon
Purchase Details
Closed on
Dec 29, 2011
Sold by
Perez Luis and Pawtucket Water Supp B
Bought by
Sherri Partners
Create a Home Valuation Report for This Property
The Home Valuation Report is an in-depth analysis detailing your home's value as well as a comparison with similar homes in the area
Home Values in the Area
Average Home Value in this Area
Tax History
| Year | Tax Paid | Tax Assessment Tax Assessment Total Assessment is a certain percentage of the fair market value that is determined by local assessors to be the total taxable value of land and additions on the property. | Land | Improvement |
|---|---|---|---|---|
| 2025 | $6,587 | $498,600 | $95,300 | $403,300 |
| 2024 | $6,676 | $354,900 | $70,300 | $284,600 |
| 2023 | $6,583 | $354,900 | $70,300 | $284,600 |
| 2022 | $4,894 | $280,300 | $70,300 | $210,000 |
| 2021 | $3,794 | $159,700 | $24,300 | $135,400 |
| 2020 | $3,783 | $159,700 | $24,300 | $135,400 |
| 2019 | $3,954 | $159,700 | $24,300 | $135,400 |
| 2018 | $3,320 | $126,200 | $23,400 | $102,800 |
| 2017 | $3,320 | $126,200 | $23,400 | $102,800 |
| 2016 | $3,272 | $126,200 | $23,400 | $102,800 |
| 2015 | $2,266 | $82,000 | $22,100 | $59,900 |
| 2014 | $2,235 | $82,000 | $22,100 | $59,900 |
| 2013 | $2,109 | $82,000 | $22,100 | $59,900 |
Source: Public Records
Map
Nearby Homes
- 152 Washington St
- 76 Sylvian St Unit 80
- 66 Perry St
- 70 Lincoln Ave
- 35 Rand St
- 7 Fales St
- 30 Foundry St Unit 6
- 234 Central St Unit 236
- 2 Valley St
- 108 Sumner Ave
- 150 Cottage St
- 517 High St
- 511 High St
- 722 Dexter St Unit 726
- 88 Barton St
- 78 Barton St
- 84 Barton St
- 396 Roosevelt Ave
- 256 High St
- 300 Front St Unit 105
- 24 Fletcher St
- 26 Fletcher St Unit 28
- 20 Fletcher St Unit 22
- 83 Washington St Unit 85
- 18 Fletcher St
- 91 Washington St
- 81 Washington St
- 95 Washington St
- 30 Fletcher St Unit 32
- 93 Washington St
- 34 Fletcher St
- 19 Fletcher St
- 23 Fletcher St
- 12 Fletcher St
- 99 Washington St
- 79 Washington St
- 79 Washington St
- 17 Fletcher St
- 29 Fletcher St Unit 31
- 4345 Fales St
Your Personal Tour Guide
Ask me questions while you tour the home.