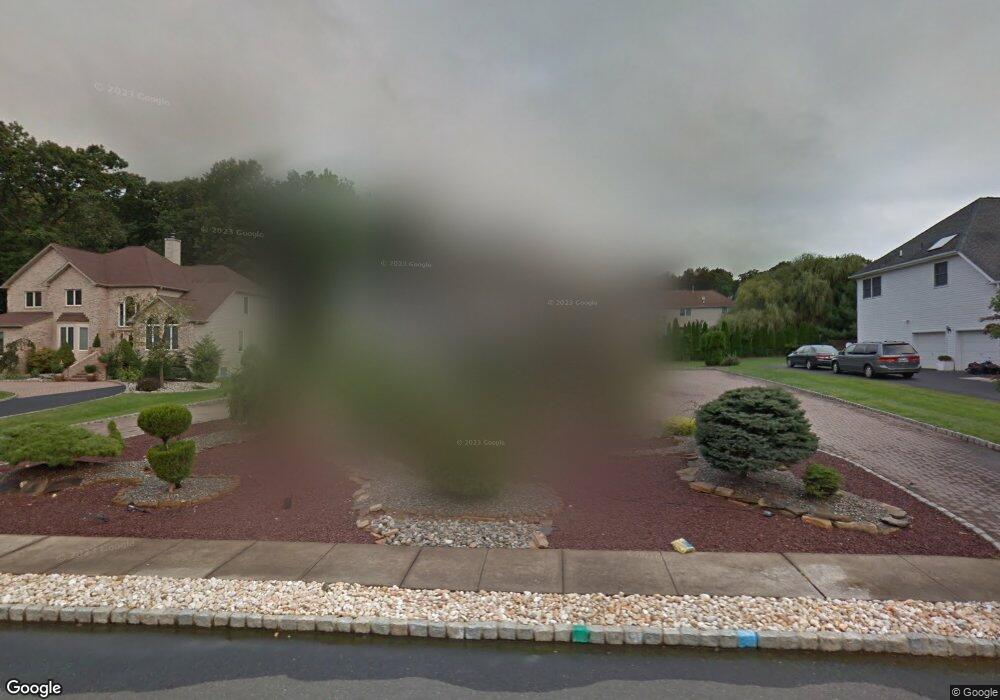
24 Forest Ct S Monmouth Junction, NJ 08852
Estimated Value: $1,013,000 - $1,358,000
4
Beds
3
Baths
3,849
Sq Ft
$317/Sq Ft
Est. Value
About This Home
This home is located at 24 Forest Ct S, Monmouth Junction, NJ 08852 and is currently estimated at $1,218,957, approximately $316 per square foot. 24 Forest Ct S is a home located in Middlesex County with nearby schools including Cambridge Elementary School, Crossroads South Middle School, and South Brunswick High School.
Ownership History
Date
Name
Owned For
Owner Type
Purchase Details
Closed on
Mar 6, 2007
Sold by
Herzinger Charles
Bought by
Naik Bharat and Naik Falguni
Current Estimated Value
Home Financials for this Owner
Home Financials are based on the most recent Mortgage that was taken out on this home.
Original Mortgage
$645,600
Outstanding Balance
$393,758
Interest Rate
6.4%
Mortgage Type
New Conventional
Estimated Equity
$825,199
Purchase Details
Closed on
May 26, 1995
Sold by
Hills Princeton
Bought by
Herzinger Charles and Rudolph Kathleen
Create a Home Valuation Report for This Property
The Home Valuation Report is an in-depth analysis detailing your home's value as well as a comparison with similar homes in the area
Home Values in the Area
Average Home Value in this Area
Purchase History
| Date | Buyer | Sale Price | Title Company |
|---|---|---|---|
| Naik Bharat | $807,000 | -- | |
| Herzinger Charles | $400,000 | -- |
Source: Public Records
Mortgage History
| Date | Status | Borrower | Loan Amount |
|---|---|---|---|
| Open | Naik Bharat | $645,600 |
Source: Public Records
Tax History Compared to Growth
Tax History
| Year | Tax Paid | Tax Assessment Tax Assessment Total Assessment is a certain percentage of the fair market value that is determined by local assessors to be the total taxable value of land and additions on the property. | Land | Improvement |
|---|---|---|---|---|
| 2025 | $20,755 | $381,100 | $90,000 | $291,100 |
| 2024 | $20,008 | $381,100 | $90,000 | $291,100 |
| 2023 | $20,008 | $381,100 | $90,000 | $291,100 |
| 2022 | $19,421 | $381,100 | $90,000 | $291,100 |
| 2021 | $19,337 | $381,100 | $90,000 | $291,100 |
| 2020 | $19,528 | $381,100 | $90,000 | $291,100 |
| 2019 | $19,699 | $381,100 | $90,000 | $291,100 |
| 2018 | $16,065 | $321,300 | $90,000 | $231,300 |
| 2017 | $16,039 | $321,300 | $90,000 | $231,300 |
| 2016 | $15,869 | $321,300 | $90,000 | $231,300 |
| 2015 | $15,387 | $321,300 | $90,000 | $231,300 |
| 2014 | $15,140 | $321,300 | $90,000 | $231,300 |
Source: Public Records
Map
Nearby Homes