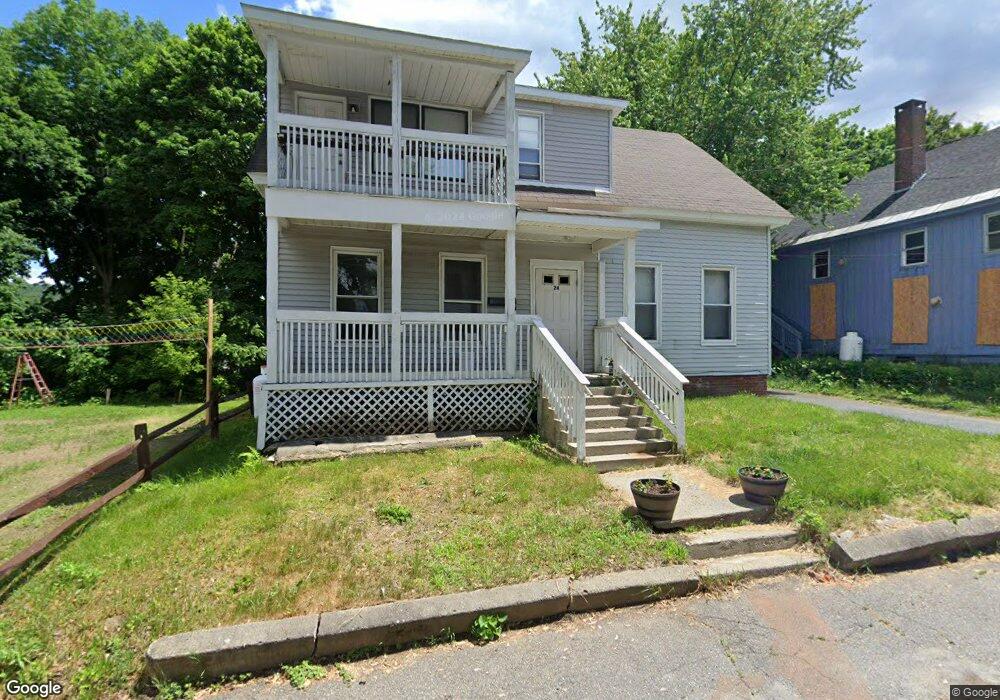
24 High St Claremont, NH 03743
East Side NeighborhoodEstimated Value: $226,000 - $362,000
9
Beds
4
Baths
3,059
Sq Ft
$92/Sq Ft
Est. Value
About This Home
Property Id: 1483304
Very Spacious 3-4 bedroom 1.5 bathroom unit on second floor available immediately. Landlord covers garbage, water & Sewer, heat and plowing. Onsite parking and walking distance to downtown Claremont with lots of storage room. Two decks. No pets. Security and first month's rent due at signing. Must be able to pass background/credit check. References required. $1950 per month. Income must be close to 3x the rent.
Ownership History
Date
Name
Owned For
Owner Type
Purchase Details
Closed on
Jul 10, 2019
Sold by
Burbee Minor J Est
Bought by
Community Circle Llc
Current Estimated Value
Purchase Details
Closed on
Sep 16, 1982
Bought by
Burbee Sara J
Create a Home Valuation Report for This Property
The Home Valuation Report is an in-depth analysis detailing your home's value as well as a comparison with similar homes in the area
Home Values in the Area
Average Home Value in this Area
Purchase History
| Date | Buyer | Sale Price | Title Company |
|---|---|---|---|
| Community Circle Llc | $16,266 | -- | |
| Community Circle Llc | $48,733 | -- | |
| Burbee Sara J | -- | -- |
Source: Public Records
Property History
| Date | Event | Price | List to Sale | Price per Sq Ft |
|---|---|---|---|---|
| 02/10/2025 02/10/25 | Off Market | -- | -- | -- |
| 01/21/2025 01/21/25 | For Rent | -- | -- | -- |
Tax History Compared to Growth
Tax History
| Year | Tax Paid | Tax Assessment Tax Assessment Total Assessment is a certain percentage of the fair market value that is determined by local assessors to be the total taxable value of land and additions on the property. | Land | Improvement |
|---|---|---|---|---|
| 2024 | $6,624 | $226,400 | $17,700 | $208,700 |
| 2023 | $5,691 | $204,700 | $17,700 | $187,000 |
| 2022 | $4,226 | $101,400 | $11,100 | $90,300 |
| 2021 | $4,139 | $101,000 | $11,100 | $89,900 |
| 2020 | $4,113 | $101,000 | $11,100 | $89,900 |
| 2019 | $4,066 | $101,000 | $11,100 | $89,900 |
| 2018 | $4,351 | $103,400 | $11,100 | $92,300 |
| 2017 | $4,411 | $103,400 | $11,100 | $92,300 |
| 2016 | $4,744 | $111,300 | $11,100 | $100,200 |
| 2015 | $4,616 | $111,300 | $11,100 | $100,200 |
| 2014 | $4,600 | $111,300 | $11,100 | $100,200 |
| 2013 | $4,792 | $132,200 | $14,100 | $118,100 |
Source: Public Records
Map
Nearby Homes