24 James St Pittston, PA 18640
Estimated Value: $99,000 - $195,000
3
Beds
2
Baths
1,496
Sq Ft
$103/Sq Ft
Est. Value
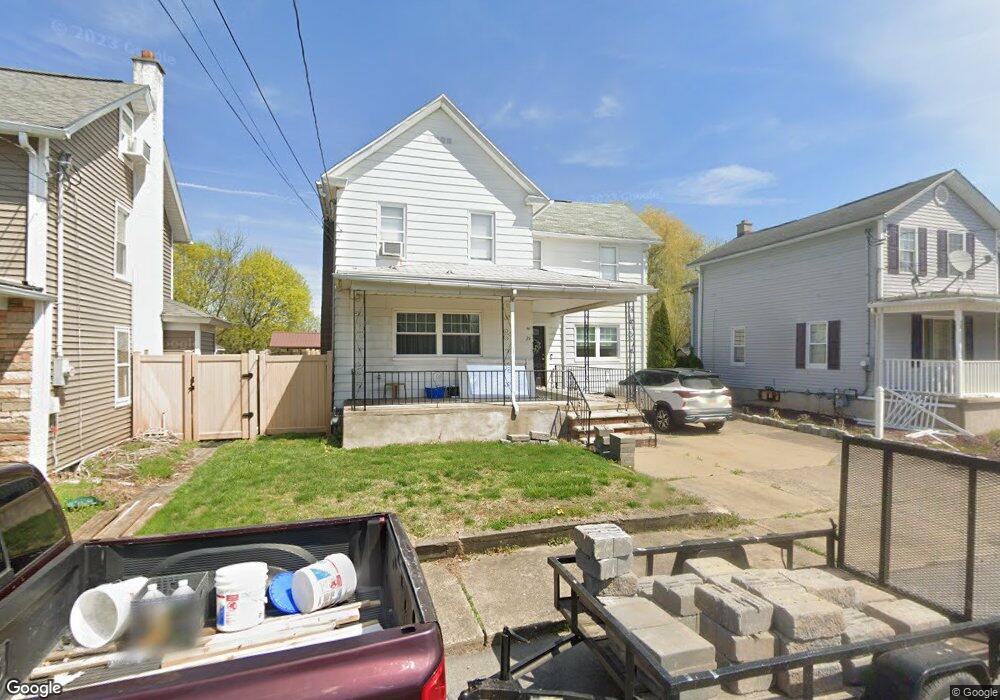
About This Home
This home is located at 24 James St, Pittston, PA 18640 and is currently estimated at $154,683, approximately $103 per square foot. 24 James St is a home located in Luzerne County with nearby schools including Pittston City Intermediate Center, Pittston Area Middle School, and Frederick County Middle School.
Ownership History
Date
Name
Owned For
Owner Type
Purchase Details
Closed on
Jul 6, 2021
Sold by
Deangelo Ellen and Deangelo Ellen Ann
Bought by
Simyan Kaitlyn
Current Estimated Value
Home Financials for this Owner
Home Financials are based on the most recent Mortgage that was taken out on this home.
Original Mortgage
$62,448
Outstanding Balance
$56,662
Interest Rate
2.9%
Mortgage Type
New Conventional
Estimated Equity
$98,021
Purchase Details
Closed on
Apr 8, 2011
Sold by
Deangelo Thomas and Deangelo Samuel
Bought by
Deangelo Ellen and Deangelo Ellen Ann
Purchase Details
Closed on
May 26, 2009
Sold by
Estate Of Sharon A Deangelo
Bought by
Deangelo Ellen
Purchase Details
Closed on
Mar 21, 2007
Sold by
Deangelo Samuel S and Deangelo Ellen Ann
Bought by
Deangelo Thomas S and Deangelo Sharon
Create a Home Valuation Report for This Property
The Home Valuation Report is an in-depth analysis detailing your home's value as well as a comparison with similar homes in the area
Home Values in the Area
Average Home Value in this Area
Purchase History
| Date | Buyer | Sale Price | Title Company |
|---|---|---|---|
| Simyan Kaitlyn | $63,600 | None Available | |
| Deangelo Ellen | -- | None Available | |
| Deangelo Ellen | -- | None Available | |
| Deangelo Ellen | -- | None Available | |
| Deangelo Thomas S | -- | None Available |
Source: Public Records
Mortgage History
| Date | Status | Borrower | Loan Amount |
|---|---|---|---|
| Open | Simyan Kaitlyn | $62,448 |
Source: Public Records
Tax History Compared to Growth
Tax History
| Year | Tax Paid | Tax Assessment Tax Assessment Total Assessment is a certain percentage of the fair market value that is determined by local assessors to be the total taxable value of land and additions on the property. | Land | Improvement |
|---|---|---|---|---|
| 2025 | $2,481 | $83,400 | $21,000 | $62,400 |
| 2024 | $2,481 | $83,400 | $21,000 | $62,400 |
| 2023 | $2,481 | $83,400 | $21,000 | $62,400 |
| 2022 | $2,465 | $83,400 | $21,000 | $62,400 |
| 2021 | $2,465 | $83,400 | $21,000 | $62,400 |
| 2020 | $2,419 | $83,400 | $21,000 | $62,400 |
| 2019 | $2,403 | $83,400 | $21,000 | $62,400 |
| 2018 | $2,361 | $83,400 | $21,000 | $62,400 |
| 2017 | $2,319 | $83,400 | $21,000 | $62,400 |
| 2016 | -- | $83,400 | $21,000 | $62,400 |
| 2015 | -- | $83,400 | $21,000 | $62,400 |
| 2014 | -- | $83,400 | $21,000 | $62,400 |
Source: Public Records
Map
Nearby Homes