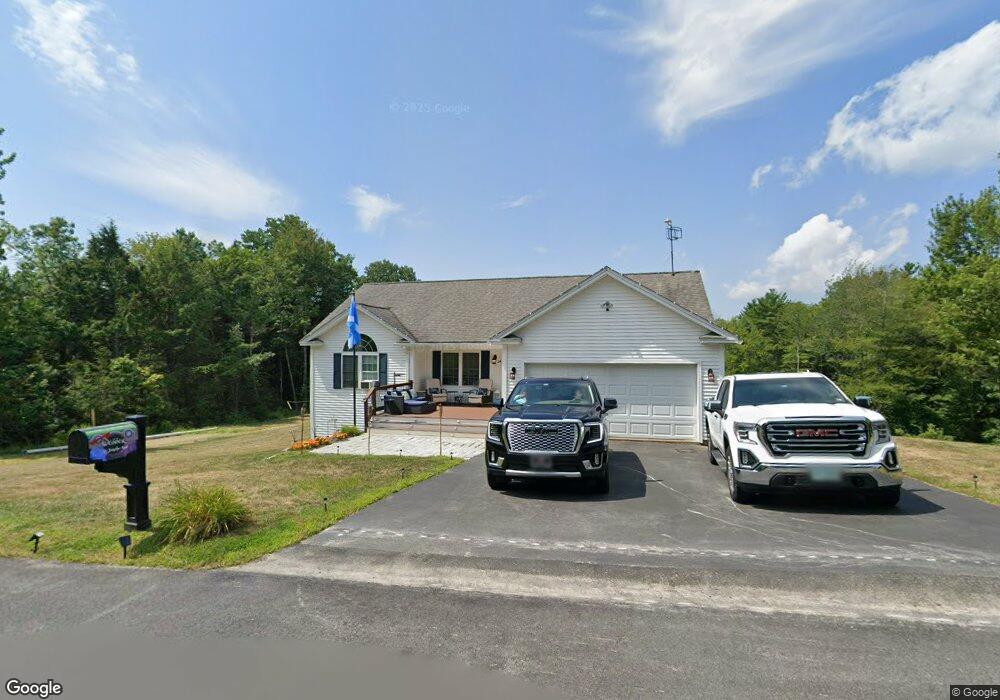
24 Jericho Rd Rindge, NH 03461
Estimated Value: $456,691 - $506,000
3
Beds
2
Baths
2,070
Sq Ft
$233/Sq Ft
Est. Value
About This Home
This home is located at 24 Jericho Rd, Rindge, NH 03461 and is currently estimated at $482,173, approximately $232 per square foot. 24 Jericho Rd is a home located in Cheshire County with nearby schools including Rindge Memorial School, Conant Middle High School, and Conant High School.
Ownership History
Date
Name
Owned For
Owner Type
Purchase Details
Closed on
Apr 11, 2011
Sold by
Kandilakis Mark and Kandilakis Sally
Bought by
Webber Garrett A and Webber Diana L
Current Estimated Value
Home Financials for this Owner
Home Financials are based on the most recent Mortgage that was taken out on this home.
Original Mortgage
$207,253
Interest Rate
4.99%
Mortgage Type
Purchase Money Mortgage
Purchase Details
Closed on
Feb 27, 2004
Sold by
Aho Raphael T
Bought by
Kandylakes Mark
Home Financials for this Owner
Home Financials are based on the most recent Mortgage that was taken out on this home.
Original Mortgage
$233,000
Interest Rate
5.65%
Mortgage Type
Purchase Money Mortgage
Create a Home Valuation Report for This Property
The Home Valuation Report is an in-depth analysis detailing your home's value as well as a comparison with similar homes in the area
Home Values in the Area
Average Home Value in this Area
Purchase History
| Date | Buyer | Sale Price | Title Company |
|---|---|---|---|
| Webber Garrett A | $194,000 | -- | |
| Kandylakes Mark | $233,000 | -- |
Source: Public Records
Mortgage History
| Date | Status | Borrower | Loan Amount |
|---|---|---|---|
| Open | Kandylakes Mark | $206,742 | |
| Closed | Kandylakes Mark | $207,253 | |
| Previous Owner | Kandylakes Mark | $233,000 |
Source: Public Records
Tax History Compared to Growth
Tax History
| Year | Tax Paid | Tax Assessment Tax Assessment Total Assessment is a certain percentage of the fair market value that is determined by local assessors to be the total taxable value of land and additions on the property. | Land | Improvement |
|---|---|---|---|---|
| 2024 | $6,444 | $254,600 | $55,200 | $199,400 |
| 2023 | $6,375 | $254,600 | $55,200 | $199,400 |
| 2022 | $5,863 | $254,600 | $55,200 | $199,400 |
| 2021 | $5,767 | $254,600 | $55,200 | $199,400 |
| 2020 | $5,716 | $254,600 | $55,200 | $199,400 |
| 2019 | $5,655 | $203,700 | $45,300 | $158,400 |
| 2018 | $5,591 | $203,300 | $45,300 | $158,000 |
| 2017 | $5,528 | $203,300 | $45,300 | $158,000 |
| 2016 | $5,674 | $203,300 | $45,300 | $158,000 |
| 2015 | $5,670 | $203,300 | $45,300 | $158,000 |
| 2014 | $5,375 | $206,500 | $70,100 | $136,400 |
| 2013 | $5,199 | $204,200 | $70,100 | $134,100 |
Source: Public Records
Map
Nearby Homes
- Lot 1 Saybrook Dr
- Lot 14 Saybrook Dr
- Lot 15-0 Saybrook Dr
- Lot 2 Saybrook Dr
- 39 Willow Ln
- 31 Willow Ln
- 37 Willow Ln
- 41 Willow Ln
- Lot 4 Saybrook Dr
- 0 Thomas Rd Unit 10 5014817
- 307 Main St
- 20 W Main St
- 40 Maple Dr
- 28 Wellington Rd
- 42 Cromwell Dr Unit 19
- 22 Daria Dr
- 7 Emerson Dr
- 19 Monomonac Terrace
- 78 Pine Eden Rd
- 26 Weidner Dr