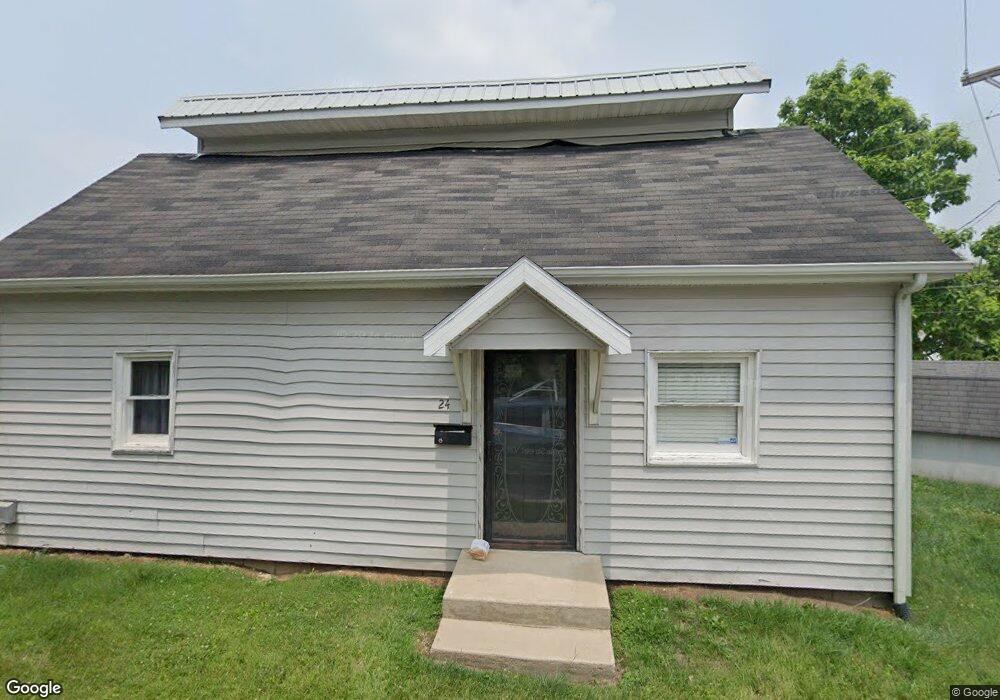
24 John St Jackson, OH 45640
Estimated Value: $141,310 - $170,000
2
Beds
1
Bath
1,296
Sq Ft
$122/Sq Ft
Est. Value
About This Home
This home is located at 24 John St, Jackson, OH 45640 and is currently estimated at $158,328, approximately $122 per square foot. 24 John St is a home located in Jackson County with nearby schools including Jackson High School and Christian Life Academy.
Ownership History
Date
Name
Owned For
Owner Type
Purchase Details
Closed on
Mar 16, 2017
Sold by
Musser Michael K and Musser Mary C
Bought by
Muncy Mary C
Current Estimated Value
Home Financials for this Owner
Home Financials are based on the most recent Mortgage that was taken out on this home.
Original Mortgage
$55,400
Outstanding Balance
$28,279
Interest Rate
4.17%
Mortgage Type
New Conventional
Estimated Equity
$130,049
Purchase Details
Closed on
Jan 6, 1997
Sold by
Pendleton Troy
Bought by
Musser Michael and Musser Mary
Create a Home Valuation Report for This Property
The Home Valuation Report is an in-depth analysis detailing your home's value as well as a comparison with similar homes in the area
Home Values in the Area
Average Home Value in this Area
Purchase History
| Date | Buyer | Sale Price | Title Company |
|---|---|---|---|
| Muncy Mary C | -- | None Available | |
| Musser Michael | $8,500 | -- |
Source: Public Records
Mortgage History
| Date | Status | Borrower | Loan Amount |
|---|---|---|---|
| Open | Muncy Mary C | $55,400 |
Source: Public Records
Tax History
| Year | Tax Paid | Tax Assessment Tax Assessment Total Assessment is a certain percentage of the fair market value that is determined by local assessors to be the total taxable value of land and additions on the property. | Land | Improvement |
|---|---|---|---|---|
| 2024 | $1,218 | $32,840 | $6,290 | $26,550 |
| 2023 | $1,240 | $32,840 | $6,290 | $26,550 |
| 2022 | $1,335 | $26,180 | $6,080 | $20,100 |
| 2021 | $1,066 | $26,180 | $6,080 | $20,100 |
| 2020 | $1,056 | $26,180 | $6,080 | $20,100 |
| 2019 | $931 | $22,570 | $5,240 | $17,330 |
| 2018 | $898 | $22,570 | $5,240 | $17,330 |
| 2017 | $860 | $22,570 | $5,240 | $17,330 |
| 2016 | $794 | $20,560 | $5,240 | $15,320 |
| 2015 | $799 | $20,560 | $5,240 | $15,320 |
| 2013 | $771 | $19,880 | $5,240 | $14,640 |
| 2012 | $782 | $19,880 | $5,240 | $14,640 |
Source: Public Records
Map
Nearby Homes
Your Personal Tour Guide
Ask me questions while you tour the home.