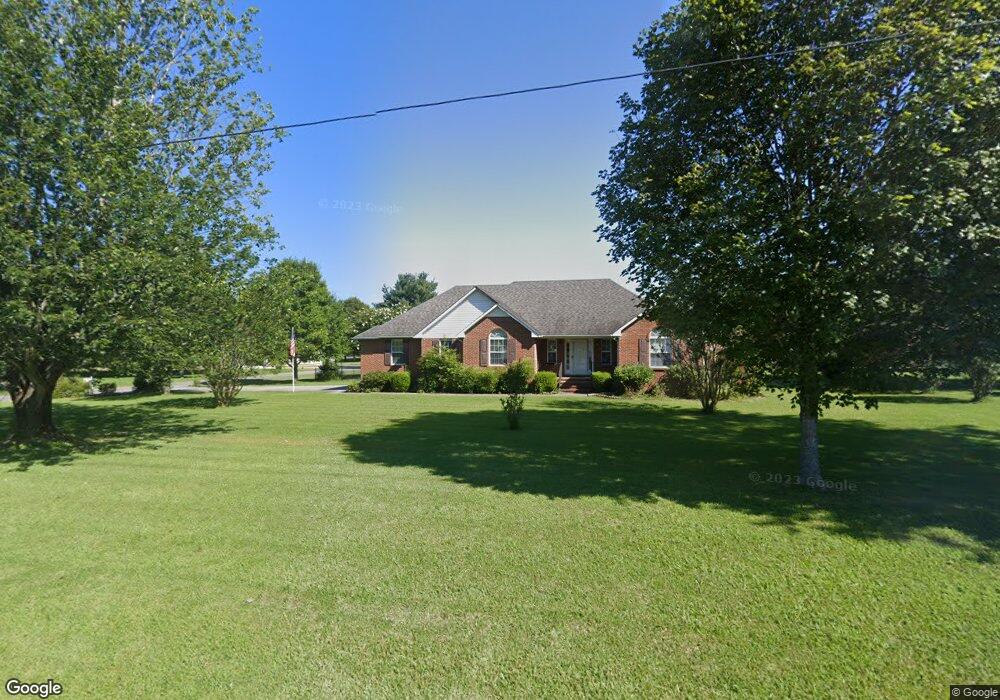
24 Kenwood Ct Manchester, TN 37355
Estimated Value: $306,574 - $390,000
--
Bed
3
Baths
1,800
Sq Ft
$193/Sq Ft
Est. Value
About This Home
This home is located at 24 Kenwood Ct, Manchester, TN 37355 and is currently estimated at $346,644, approximately $192 per square foot. 24 Kenwood Ct is a home located in Coffee County with nearby schools including New Union Elementary School, Coffee County Middle School, and Coffee County Central High School.
Ownership History
Date
Name
Owned For
Owner Type
Purchase Details
Closed on
Dec 7, 2016
Sold by
May Jane A
Bought by
Mitchum Jane A Life Estate
Current Estimated Value
Purchase Details
Closed on
Apr 30, 2003
Sold by
Cendant Mobility Services
Bought by
May Jane A
Purchase Details
Closed on
Feb 20, 2003
Purchase Details
Closed on
Sep 26, 2001
Sold by
Yeske Steven R and Yeske Belinda G
Bought by
Casteen Mike and Casteen Bonnie
Home Financials for this Owner
Home Financials are based on the most recent Mortgage that was taken out on this home.
Original Mortgage
$103,700
Interest Rate
8.75%
Purchase Details
Closed on
Apr 17, 1997
Sold by
Delk Jimmie M
Bought by
Yeske Steven R and Yeske Belinda
Purchase Details
Closed on
Aug 23, 1994
Sold by
Williams Clyde and Williams Madalyn
Bought by
Amado David
Purchase Details
Closed on
May 2, 1994
Sold by
Anderson Fred and Anderson Letha
Bought by
Wilson Charles and Wilson Arlene
Purchase Details
Closed on
Apr 11, 1994
Sold by
Duke Larry and Duke Jill
Bought by
Crabtree Richard and Crabtree Allis
Create a Home Valuation Report for This Property
The Home Valuation Report is an in-depth analysis detailing your home's value as well as a comparison with similar homes in the area
Home Values in the Area
Average Home Value in this Area
Purchase History
| Date | Buyer | Sale Price | Title Company |
|---|---|---|---|
| Mitchum Jane A Life Estate | -- | -- | |
| May Jane A | $137,500 | -- | |
| -- | $137,500 | -- | |
| Casteen Mike | $122,000 | -- | |
| Yeske Steven R | $10,000 | -- | |
| Amado David | -- | -- | |
| Wilson Charles | $102,000 | -- | |
| Crabtree Richard | $85,000 | -- |
Source: Public Records
Mortgage History
| Date | Status | Borrower | Loan Amount |
|---|---|---|---|
| Previous Owner | Crabtree Richard | $103,700 |
Source: Public Records
Tax History Compared to Growth
Tax History
| Year | Tax Paid | Tax Assessment Tax Assessment Total Assessment is a certain percentage of the fair market value that is determined by local assessors to be the total taxable value of land and additions on the property. | Land | Improvement |
|---|---|---|---|---|
| 2024 | $1,264 | $59,675 | $6,250 | $53,425 |
| 2023 | $1,264 | $59,675 | $0 | $0 |
| 2022 | $1,264 | $59,675 | $6,250 | $53,425 |
| 2021 | $1,264 | $44,050 | $3,750 | $40,300 |
| 2020 | $1,264 | $44,050 | $3,750 | $40,300 |
| 2019 | $1,264 | $44,050 | $3,750 | $40,300 |
| 2018 | $1,264 | $44,050 | $3,750 | $40,300 |
| 2017 | $1,264 | $38,750 | $3,750 | $35,000 |
| 2016 | $1,264 | $38,750 | $3,750 | $35,000 |
| 2015 | $1,264 | $38,750 | $3,750 | $35,000 |
| 2014 | $1,264 | $38,750 | $0 | $0 |
Source: Public Records
Map
Nearby Homes
- 2262 Woodbury Hwy
- 106 Rigney Rd
- 1579 Woodbury Hwy
- 239 Executive Ct
- 67 Eldon Dr
- 493 Maple Springs Rd
- 621 Brandon Rd
- 676 Riddle Rd
- 163 Stonehenge Ln
- 0 Fredonia Rd Unit RTC3043164
- 0 Fredonia Rd Unit RTC2945295
- 417 Whispering Winds Dr
- 220 Winton Way Rd
- 97 Stonehenge Ln
- 216 Stonehenge Cir
- 110 Phillips Dr
- 67 Stonehenge Ln
- 133 Stonehenge Cir
- 153 Stonehenge Cir
- 49 Stonehenge
- 249 Wakefield Dr
- 72 Kenwood Ct
- 187 Wakefield Dr
- 43 Kenwood Ct
- 0 Kenwood Ct
- 236 Wakefield Dr
- 212 Wakefield Dr
- 65 Kenwood Ct
- 106 Kenwood Ct
- 186 Wakefield Dr
- 308 Edgefield Dr
- 107 Kenwood Ct
- 85 Kenwood Ct
- 164 Wakefield Dr
- 148 Angus Ln
- 143 Wakefield Dr
- 235 Edgefield Dr
- 209 Edgefield Dr
- 278 Edgefield Dr
- 2477 Woodbury Hwy Unit 2477