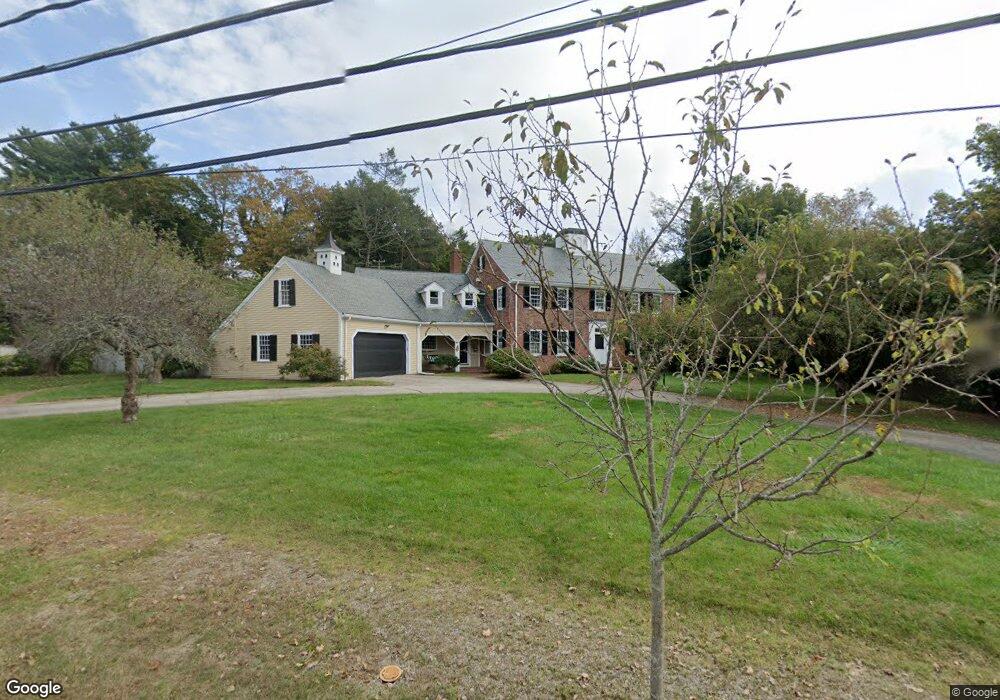
24 Lansing Rd West Newton, MA 02465
West Newton NeighborhoodEstimated Value: $2,936,961 - $3,679,000
4
Beds
5
Baths
3,814
Sq Ft
$830/Sq Ft
Est. Value
About This Home
This home is located at 24 Lansing Rd, West Newton, MA 02465 and is currently estimated at $3,164,740, approximately $829 per square foot. 24 Lansing Rd is a home located in Middlesex County with nearby schools including Peirce Elementary School, F.A. Day Middle School, and Newton North High School.
Ownership History
Date
Name
Owned For
Owner Type
Purchase Details
Closed on
Jul 22, 2015
Sold by
Bass Robin
Bought by
Robin Bass Ret
Current Estimated Value
Purchase Details
Closed on
Jan 20, 2010
Sold by
Urban Robin Bass
Bought by
Bass Robin
Home Financials for this Owner
Home Financials are based on the most recent Mortgage that was taken out on this home.
Original Mortgage
$368,900
Interest Rate
4.79%
Mortgage Type
Purchase Money Mortgage
Purchase Details
Closed on
Sep 12, 2003
Sold by
Urban Robin M B and Urban Andrew R
Bought by
Urban Robin Bass
Home Financials for this Owner
Home Financials are based on the most recent Mortgage that was taken out on this home.
Original Mortgage
$400,000
Interest Rate
6.22%
Create a Home Valuation Report for This Property
The Home Valuation Report is an in-depth analysis detailing your home's value as well as a comparison with similar homes in the area
Home Values in the Area
Average Home Value in this Area
Purchase History
| Date | Buyer | Sale Price | Title Company |
|---|---|---|---|
| Robin Bass Ret | -- | -- | |
| Bass Robin | -- | -- | |
| Urban Robin Bass | -- | -- |
Source: Public Records
Mortgage History
| Date | Status | Borrower | Loan Amount |
|---|---|---|---|
| Previous Owner | Bass Robin | $368,900 | |
| Previous Owner | Urban Robin Bass | $400,000 |
Source: Public Records
Tax History Compared to Growth
Tax History
| Year | Tax Paid | Tax Assessment Tax Assessment Total Assessment is a certain percentage of the fair market value that is determined by local assessors to be the total taxable value of land and additions on the property. | Land | Improvement |
|---|---|---|---|---|
| 2025 | $28,672 | $2,925,700 | $1,934,500 | $991,200 |
| 2024 | $27,723 | $2,840,500 | $1,878,200 | $962,300 |
| 2023 | $27,334 | $2,685,100 | $1,508,000 | $1,177,100 |
| 2022 | $26,155 | $2,486,200 | $1,396,300 | $1,089,900 |
| 2021 | $25,238 | $2,345,500 | $1,317,300 | $1,028,200 |
| 2020 | $24,487 | $2,345,500 | $1,317,300 | $1,028,200 |
| 2019 | $23,797 | $2,277,200 | $1,278,900 | $998,300 |
| 2018 | $23,282 | $2,151,800 | $1,142,400 | $1,009,400 |
| 2017 | $22,574 | $2,030,000 | $1,077,700 | $952,300 |
| 2016 | $21,590 | $1,897,200 | $1,007,200 | $890,000 |
| 2015 | $21,792 | $1,877,000 | $941,300 | $935,700 |
Source: Public Records
Map
Nearby Homes
- 10 Ruane Rd
- 1640 Commonwealth Ave
- 115 Windsor Rd
- 29 Montclair Rd
- 40 Sewall St
- 18 Sewall St
- 308 Prince St
- 1430 Beacon St
- 97 Valentine St
- 1754 Washington St
- 1639 Washington St
- 20 Kinmonth Rd Unit 203
- 20 Kinmonth Rd Unit 306
- 80 Pine Ridge Rd
- 283 Woodland Rd
- 23 Gilbert St
- 17 Gilbert St
- 33 Metacomet Rd
- 0 Duncan Rd Unit 72925240
- 1801 Beacon St
- 8 Lansing Rd
- 161 Dartmouth St
- 145 Dartmouth St
- 36 Lansing Rd
- 200 Fuller St
- 19 Lansing Rd
- 133 Dartmouth St
- 226 Fuller St
- 192 Fuller St
- 29 Lansing Rd
- 115 Dartmouth St
- 37 Lansing Rd
- 107 Dartmouth St
- 209 Fuller St
- 201 Fuller St
- 140 Dartmouth St
- 242 Fuller St
- 160 Dartmouth St
- 219 Fuller St
- 170 Dartmouth St