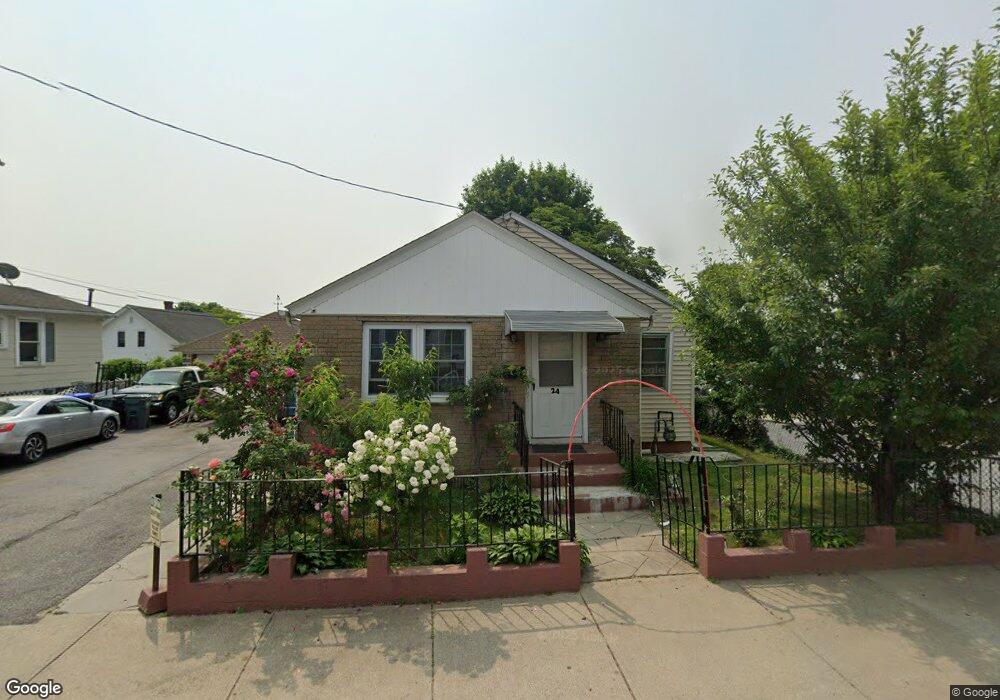
24 Leah St Providence, RI 02908
Mount Pleasant NeighborhoodEstimated Value: $334,000 - $375,000
3
Beds
1
Bath
1,812
Sq Ft
$196/Sq Ft
Est. Value
About This Home
This home is located at 24 Leah St, Providence, RI 02908 and is currently estimated at $354,379, approximately $195 per square foot. 24 Leah St is a home located in Providence County with nearby schools including Charles N. Fortes Elementary School, Asa Messer Elementary School, and Laurel Hill Annex School.
Ownership History
Date
Name
Owned For
Owner Type
Purchase Details
Closed on
Mar 27, 2006
Sold by
Lopez Jose and Lopez Flor
Bought by
Recinos Lazaro
Current Estimated Value
Home Financials for this Owner
Home Financials are based on the most recent Mortgage that was taken out on this home.
Original Mortgage
$162,000
Interest Rate
6.28%
Mortgage Type
Purchase Money Mortgage
Purchase Details
Closed on
Feb 28, 1997
Sold by
Serna Jesus
Bought by
Lopes Jose A and Lopes Flor
Home Financials for this Owner
Home Financials are based on the most recent Mortgage that was taken out on this home.
Original Mortgage
$68,916
Interest Rate
7.78%
Create a Home Valuation Report for This Property
The Home Valuation Report is an in-depth analysis detailing your home's value as well as a comparison with similar homes in the area
Home Values in the Area
Average Home Value in this Area
Purchase History
| Date | Buyer | Sale Price | Title Company |
|---|---|---|---|
| Recinos Lazaro | $180,000 | -- | |
| Lopes Jose A | $69,000 | -- |
Source: Public Records
Mortgage History
| Date | Status | Borrower | Loan Amount |
|---|---|---|---|
| Open | Lopes Jose A | $172,850 | |
| Closed | Lopes Jose A | $162,000 | |
| Previous Owner | Lopes Jose A | $68,916 |
Source: Public Records
Tax History Compared to Growth
Tax History
| Year | Tax Paid | Tax Assessment Tax Assessment Total Assessment is a certain percentage of the fair market value that is determined by local assessors to be the total taxable value of land and additions on the property. | Land | Improvement |
|---|---|---|---|---|
| 2025 | $2,680 | $319,000 | $129,700 | $189,300 |
| 2024 | $4,233 | $230,700 | $75,000 | $155,700 |
| 2023 | $4,233 | $230,700 | $75,000 | $155,700 |
| 2022 | $4,106 | $230,700 | $75,000 | $155,700 |
| 2021 | $3,974 | $161,800 | $54,800 | $107,000 |
| 2020 | $3,974 | $161,800 | $54,800 | $107,000 |
| 2019 | $3,974 | $161,800 | $54,800 | $107,000 |
| 2018 | $3,321 | $103,900 | $35,200 | $68,700 |
| 2017 | $3,321 | $103,900 | $35,200 | $68,700 |
| 2016 | $3,321 | $103,900 | $35,200 | $68,700 |
| 2015 | $3,082 | $93,100 | $32,200 | $60,900 |
| 2014 | $3,142 | $93,100 | $32,200 | $60,900 |
| 2013 | $3,142 | $93,100 | $32,200 | $60,900 |
Source: Public Records
Map
Nearby Homes