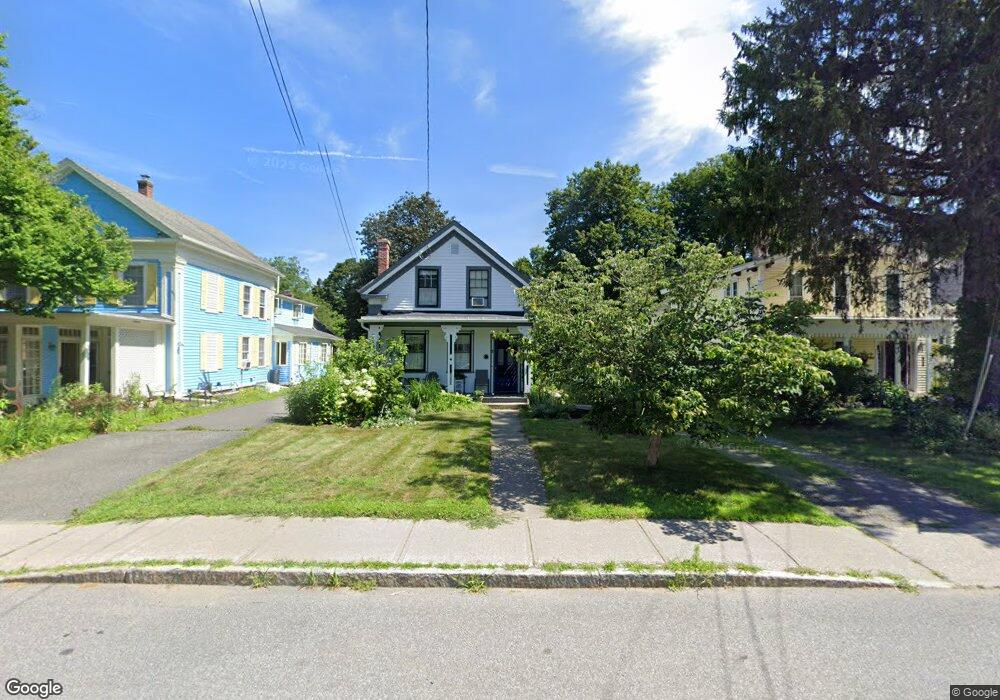
24 Main St Conway, MA 01341
Estimated Value: $360,000 - $515,000
3
Beds
2
Baths
1,299
Sq Ft
$316/Sq Ft
Est. Value
About This Home
This home is located at 24 Main St, Conway, MA 01341 and is currently estimated at $409,846, approximately $315 per square foot. 24 Main St is a home located in Franklin County with nearby schools including Frontier Regional School.
Ownership History
Date
Name
Owned For
Owner Type
Purchase Details
Closed on
Jul 2, 2020
Sold by
Thompson Mary B
Bought by
Thompson-Landry Amy
Current Estimated Value
Home Financials for this Owner
Home Financials are based on the most recent Mortgage that was taken out on this home.
Original Mortgage
$120,000
Outstanding Balance
$82,508
Interest Rate
3.2%
Mortgage Type
New Conventional
Estimated Equity
$327,338
Purchase Details
Closed on
Jul 18, 2008
Sold by
Landry Amy T and Landry Christopher E
Bought by
Landry Amy T and Thompson Jonathan
Home Financials for this Owner
Home Financials are based on the most recent Mortgage that was taken out on this home.
Original Mortgage
$155,000
Interest Rate
6.17%
Mortgage Type
Purchase Money Mortgage
Purchase Details
Closed on
Jun 26, 1995
Sold by
Clark Mildred F and Clark Jon S
Bought by
Landry Christopher E and Landry Amy T
Home Financials for this Owner
Home Financials are based on the most recent Mortgage that was taken out on this home.
Original Mortgage
$79,300
Interest Rate
7.82%
Mortgage Type
Purchase Money Mortgage
Create a Home Valuation Report for This Property
The Home Valuation Report is an in-depth analysis detailing your home's value as well as a comparison with similar homes in the area
Home Values in the Area
Average Home Value in this Area
Purchase History
| Date | Buyer | Sale Price | Title Company |
|---|---|---|---|
| Thompson-Landry Amy | -- | None Available | |
| Landry Amy T | -- | -- | |
| Landry Amy T | -- | -- | |
| Landry Christopher E | $83,500 | -- |
Source: Public Records
Mortgage History
| Date | Status | Borrower | Loan Amount |
|---|---|---|---|
| Open | Thompson-Landry Amy | $120,000 | |
| Previous Owner | Landry Amy T | $155,000 | |
| Previous Owner | Landry Christopher E | $134,500 | |
| Previous Owner | Landry Christopher E | $78,000 | |
| Previous Owner | Landry Christopher E | $79,300 |
Source: Public Records
Tax History
| Year | Tax Paid | Tax Assessment Tax Assessment Total Assessment is a certain percentage of the fair market value that is determined by local assessors to be the total taxable value of land and additions on the property. | Land | Improvement |
|---|---|---|---|---|
| 2025 | $4,928 | $341,300 | $72,700 | $268,600 |
| 2024 | $4,477 | $273,000 | $66,100 | $206,900 |
| 2023 | $4,682 | $273,000 | $66,100 | $206,900 |
| 2022 | $4,538 | $252,800 | $61,200 | $191,600 |
| 2021 | $4,471 | $238,700 | $58,500 | $180,200 |
| 2020 | $4,009 | $213,700 | $58,500 | $155,200 |
| 2019 | $3,986 | $213,700 | $58,500 | $155,200 |
| 2018 | $3,952 | $213,600 | $58,500 | $155,100 |
| 2017 | $3,791 | $213,600 | $58,500 | $155,100 |
| 2016 | $3,406 | $204,200 | $51,100 | $153,100 |
| 2015 | $3,302 | $204,200 | $51,100 | $153,100 |
Source: Public Records
Map
Nearby Homes
- 71 Mathews Rd
- 15 Stillwater Rd
- 41 Upper Rd
- 2930 Shelburne Falls Rd
- 240 Beldingville Rd
- 0 N Bear River Rd Unit 73485981
- 90 Whately Rd
- 345 Greenfield Rd
- 208 Greenfield Rd
- 527 Main St
- 24 Elm St
- 0 Greenfield Rd Unit 73472322
- 26 S Main St
- 0 North St Unit 73407299
- 15 Crestview Dr
- 18 Stage Rd
- 40 Suburban Dr
- 0 Pocumtuck Dr Unit 73379330
- 259 Wisdom Way
- 0 Sears Rd Unit 73373850
Your Personal Tour Guide
Ask me questions while you tour the home.