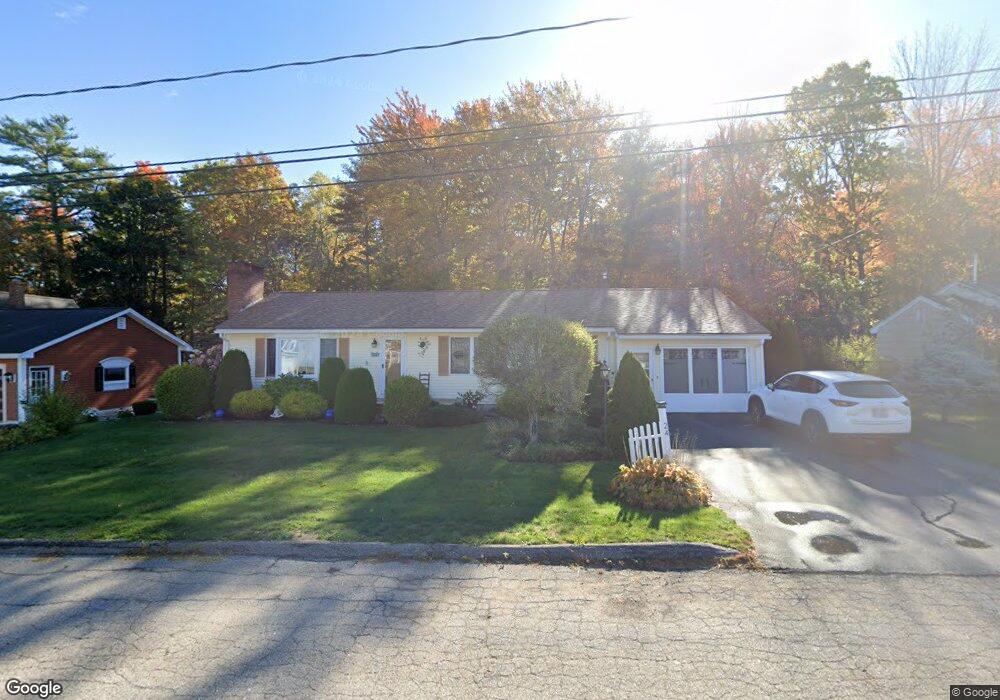
24 Marion Ave Biddeford, ME 04005
Estimated Value: $392,190 - $461,000
3
Beds
1
Bath
1,080
Sq Ft
$392/Sq Ft
Est. Value
About This Home
This home is located at 24 Marion Ave, Biddeford, ME 04005 and is currently estimated at $423,798, approximately $392 per square foot. 24 Marion Ave is a home located in York County with nearby schools including John F Kennedy Memorial School, Biddeford Primary School, and Biddeford Intermediate School.
Ownership History
Date
Name
Owned For
Owner Type
Purchase Details
Closed on
Nov 7, 2022
Sold by
Cook Doris M
Bought by
Doris M Cook Lt
Current Estimated Value
Purchase Details
Closed on
Aug 16, 2005
Sold by
Fecteau Gisele R
Bought by
Cook Doris M and Cook Richard A
Home Financials for this Owner
Home Financials are based on the most recent Mortgage that was taken out on this home.
Original Mortgage
$30,000
Interest Rate
5.54%
Mortgage Type
Purchase Money Mortgage
Create a Home Valuation Report for This Property
The Home Valuation Report is an in-depth analysis detailing your home's value as well as a comparison with similar homes in the area
Home Values in the Area
Average Home Value in this Area
Purchase History
| Date | Buyer | Sale Price | Title Company |
|---|---|---|---|
| Doris M Cook Lt | -- | None Available | |
| Cook Doris M | -- | -- |
Source: Public Records
Mortgage History
| Date | Status | Borrower | Loan Amount |
|---|---|---|---|
| Previous Owner | Cook Doris M | $30,000 |
Source: Public Records
Tax History Compared to Growth
Tax History
| Year | Tax Paid | Tax Assessment Tax Assessment Total Assessment is a certain percentage of the fair market value that is determined by local assessors to be the total taxable value of land and additions on the property. | Land | Improvement |
|---|---|---|---|---|
| 2024 | $4,385 | $308,400 | $147,700 | $160,700 |
| 2023 | $4,013 | $305,900 | $145,200 | $160,700 |
| 2022 | $4,006 | $244,100 | $85,900 | $158,200 |
| 2021 | $3,821 | $209,600 | $74,100 | $135,500 |
| 2020 | $3,318 | $190,000 | $65,200 | $124,800 |
| 2019 | $3,796 | $190,000 | $65,200 | $124,800 |
| 2018 | $3,743 | $190,000 | $65,200 | $124,800 |
| 2017 | $3,492 | $174,000 | $65,200 | $108,800 |
| 2016 | $3,456 | $174,000 | $65,200 | $108,800 |
| 2015 | $3,193 | $174,000 | $65,200 | $108,800 |
| 2014 | $3,114 | $174,000 | $65,200 | $108,800 |
| 2013 | -- | $193,300 | $75,000 | $118,300 |
Source: Public Records
Map
Nearby Homes