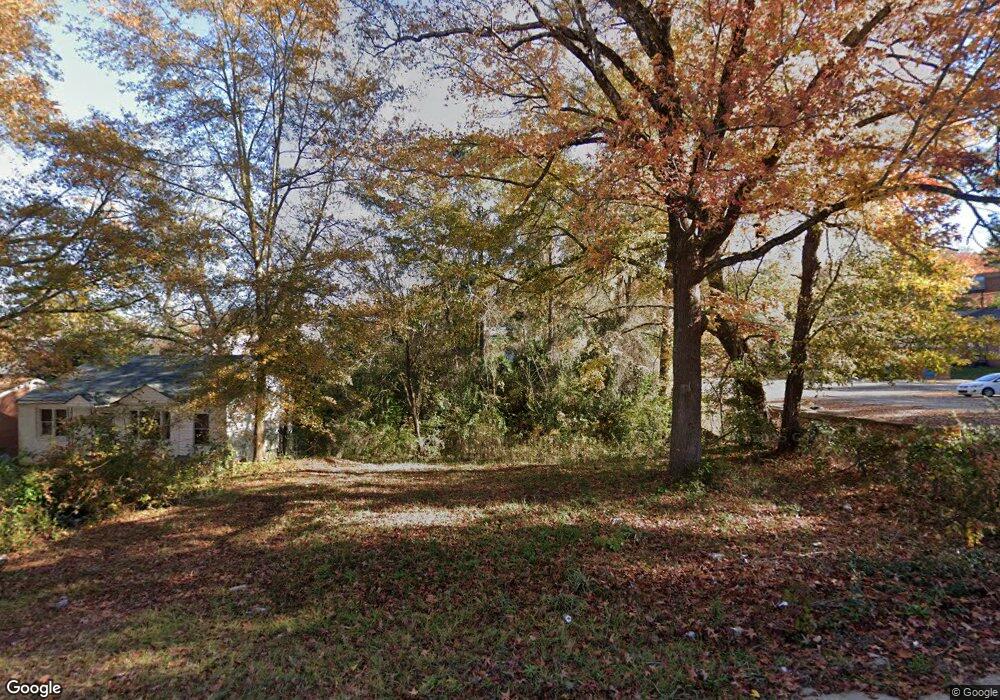
24 Mason Dr Columbus, GA 31903
Southern Columbus NeighborhoodEstimated Value: $16,000
3
Beds
1
Bath
966
Sq Ft
$17/Sq Ft
Est. Value
About This Home
This home is located at 24 Mason Dr, Columbus, GA 31903 and is currently estimated at $16,000, approximately $16 per square foot. 24 Mason Dr is a home located in Muscogee County with nearby schools including Glenallen Elementary School, South Columbus Elementary School, and Eddy Middle School.
Ownership History
Date
Name
Owned For
Owner Type
Purchase Details
Closed on
Dec 2, 2024
Sold by
Armour Jesse
Bought by
Rogers Dexter W
Current Estimated Value
Purchase Details
Closed on
Feb 2, 2018
Sold by
Sermons Theodore
Bought by
Armour Jesse
Purchase Details
Closed on
May 25, 2017
Sold by
Torres Eustaquio Jose
Bought by
Sermons Theodore
Purchase Details
Closed on
Jun 22, 2015
Sold by
Vollentine Steven
Bought by
Torres Eustaquio Jose and Martin Amanda
Purchase Details
Closed on
Dec 6, 2010
Sold by
Vollentine Steven
Bought by
Vollentine Steven
Create a Home Valuation Report for This Property
The Home Valuation Report is an in-depth analysis detailing your home's value as well as a comparison with similar homes in the area
Home Values in the Area
Average Home Value in this Area
Purchase History
| Date | Buyer | Sale Price | Title Company |
|---|---|---|---|
| Rogers Dexter W | -- | None Listed On Document | |
| Rogers Dexter W | -- | None Listed On Document | |
| Armour Jesse | -- | -- | |
| Sermons Theodore | -- | -- | |
| Torres Eustaquio Jose | $1,500 | -- | |
| Vollentine Steven | -- | None Available |
Source: Public Records
Tax History Compared to Growth
Tax History
| Year | Tax Paid | Tax Assessment Tax Assessment Total Assessment is a certain percentage of the fair market value that is determined by local assessors to be the total taxable value of land and additions on the property. | Land | Improvement |
|---|---|---|---|---|
| 2025 | $7,525 | $4,604 | $4,604 | $0 |
| 2024 | $6,978 | $3,400 | $3,400 | $0 |
| 2023 | $134 | $3,400 | $3,400 | $0 |
| 2022 | $139 | $3,400 | $3,400 | $0 |
| 2021 | $155 | $3,400 | $3,400 | $0 |
| 2020 | $139 | $3,400 | $3,400 | $0 |
| 2019 | $241 | $5,892 | $3,400 | $2,492 |
| 2018 | $241 | $5,892 | $3,400 | $2,492 |
| 2017 | $3,003 | $5,892 | $3,400 | $2,492 |
| 2016 | $25 | $600 | $149 | $451 |
| 2015 | $140 | $8,471 | $2,104 | $6,367 |
| 2014 | $140 | $8,471 | $2,104 | $6,367 |
| 2013 | -- | $8,471 | $2,104 | $6,367 |
Source: Public Records
Map
Nearby Homes