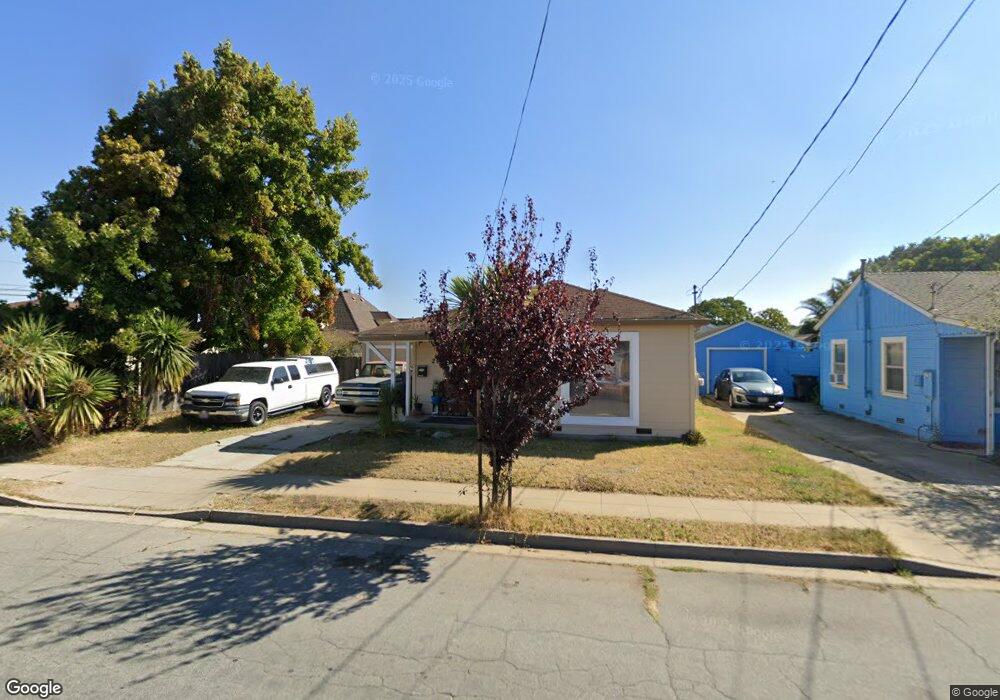
24 N 3rd St Salinas, CA 93906
Northridge NeighborhoodEstimated Value: $541,112 - $622,000
2
Beds
1
Bath
968
Sq Ft
$599/Sq Ft
Est. Value
About This Home
This home is located at 24 N 3rd St, Salinas, CA 93906 and is currently estimated at $580,028, approximately $599 per square foot. 24 N 3rd St is a home located in Monterey County with nearby schools including Henry F. Kammann Elementary School, Boronda Meadows Elementary School, and Harden Middle School.
Ownership History
Date
Name
Owned For
Owner Type
Purchase Details
Closed on
Oct 26, 2011
Sold by
Fannie Mae
Bought by
Cutting Brian H
Current Estimated Value
Home Financials for this Owner
Home Financials are based on the most recent Mortgage that was taken out on this home.
Original Mortgage
$175,437
Outstanding Balance
$120,207
Interest Rate
4.12%
Mortgage Type
FHA
Estimated Equity
$459,821
Purchase Details
Closed on
Feb 17, 2011
Sold by
Crackel Martin
Bought by
Fannie Mae and Federal National Mortgage Association
Purchase Details
Closed on
Aug 28, 2001
Sold by
Mariscal Carmen M
Bought by
Crackel Martin
Home Financials for this Owner
Home Financials are based on the most recent Mortgage that was taken out on this home.
Original Mortgage
$166,400
Interest Rate
7.09%
Purchase Details
Closed on
Nov 8, 2000
Sold by
Collin Robert
Bought by
Collin Robert and Robert Collin Living Trust
Purchase Details
Closed on
Jul 18, 1995
Sold by
Towle Mona Jones
Bought by
Mariscal Alejandro C and Mariscal Carmen M
Home Financials for this Owner
Home Financials are based on the most recent Mortgage that was taken out on this home.
Original Mortgage
$121,064
Interest Rate
7.62%
Mortgage Type
FHA
Create a Home Valuation Report for This Property
The Home Valuation Report is an in-depth analysis detailing your home's value as well as a comparison with similar homes in the area
Home Values in the Area
Average Home Value in this Area
Purchase History
| Date | Buyer | Sale Price | Title Company |
|---|---|---|---|
| Cutting Brian H | $180,000 | Chicago Title Company | |
| Fannie Mae | $295,192 | Accommodation | |
| Crackel Martin | $208,000 | Stewart Title | |
| Collin Robert | -- | -- | |
| Mariscal Alejandro C | $122,000 | Stewart Title |
Source: Public Records
Mortgage History
| Date | Status | Borrower | Loan Amount |
|---|---|---|---|
| Open | Cutting Brian H | $175,437 | |
| Previous Owner | Crackel Martin | $166,400 | |
| Previous Owner | Mariscal Alejandro C | $121,064 |
Source: Public Records
Tax History Compared to Growth
Tax History
| Year | Tax Paid | Tax Assessment Tax Assessment Total Assessment is a certain percentage of the fair market value that is determined by local assessors to be the total taxable value of land and additions on the property. | Land | Improvement |
|---|---|---|---|---|
| 2025 | $2,544 | $226,076 | $62,796 | $163,280 |
| 2024 | $2,544 | $221,644 | $61,565 | $160,079 |
| 2023 | $2,457 | $217,299 | $60,358 | $156,941 |
| 2022 | $2,363 | $213,039 | $59,175 | $153,864 |
| 2021 | $2,269 | $208,863 | $58,015 | $150,848 |
| 2020 | $2,428 | $206,723 | $57,421 | $149,302 |
| 2019 | $2,187 | $202,671 | $56,296 | $146,375 |
| 2018 | $2,393 | $198,698 | $55,193 | $143,505 |
| 2017 | $2,156 | $194,803 | $54,111 | $140,692 |
| 2016 | $2,156 | $190,984 | $53,050 | $137,934 |
| 2015 | $2,173 | $188,117 | $52,254 | $135,863 |
| 2014 | $2,028 | $184,433 | $51,231 | $133,202 |
Source: Public Records
Map
Nearby Homes
- 129 Rodeo Ave
- 216 Crescent Way
- 417 Tyler Place Unit I
- 1117 Baldwin St Unit 5
- 1226 Monroe St
- 225 Loma Dr
- 730 N Main St
- 114 Iris Dr
- 1840 Cherokee Dr Unit 2
- 1575 Sepulveda Dr
- 1518 Duran Cir
- 1588 Cherokee Dr
- 354 Chaparral St
- 1521 Ebro Cir
- 1861 Cherokee Dr Unit 1
- 44 Oconnor Cir
- 1690 Cherokee Dr
- 983 Flint Way
- 1634 Cuevas Cir Unit 5
- 13 Saint Brendan Way