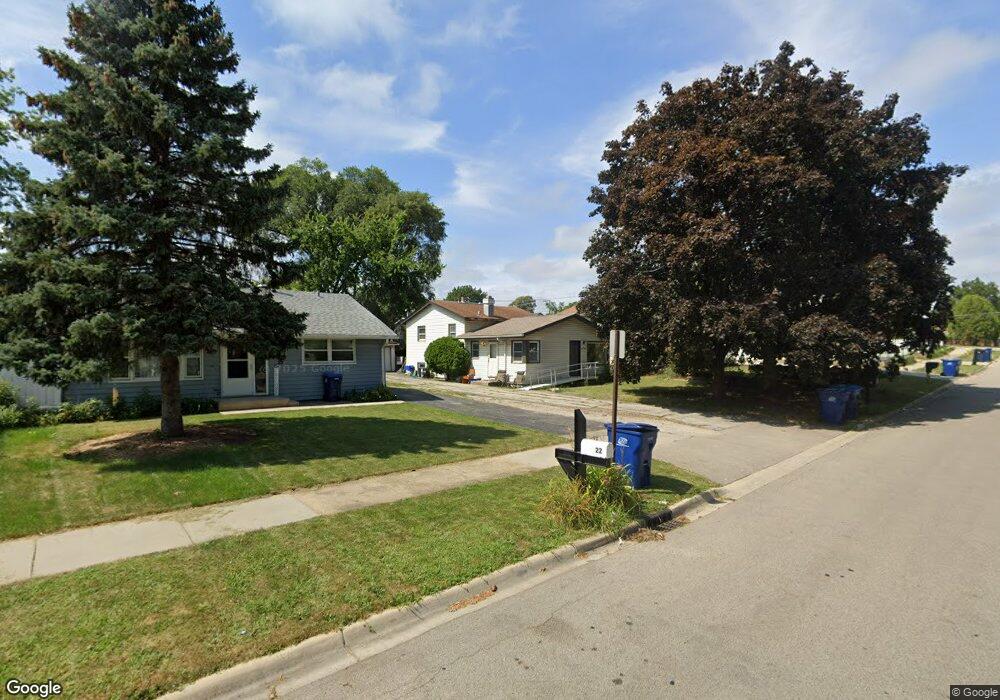
24 N Pioneer Rd Waukegan, IL 60085
Washington Hills NeighborhoodEstimated Value: $206,000 - $249,000
3
Beds
1
Bath
960
Sq Ft
$238/Sq Ft
Est. Value
About This Home
This home is located at 24 N Pioneer Rd, Waukegan, IL 60085 and is currently estimated at $228,493, approximately $238 per square foot. 24 N Pioneer Rd is a home located in Lake County with nearby schools including Whittier Elementary School, Robert E. Abbott Middle School, and Waukegan High School.
Ownership History
Date
Name
Owned For
Owner Type
Purchase Details
Closed on
Apr 24, 2004
Sold by
Spriggs Linda and Spriggs Michael W
Bought by
Spriggs Linda
Current Estimated Value
Purchase Details
Closed on
Apr 19, 2001
Sold by
Spriggs Linda
Bought by
Spriggs Michael W and Spriggs Linda
Home Financials for this Owner
Home Financials are based on the most recent Mortgage that was taken out on this home.
Original Mortgage
$79,414
Interest Rate
6.95%
Mortgage Type
FHA
Purchase Details
Closed on
Jul 13, 1995
Sold by
Spriggs Michael W
Bought by
Spriggs Linda
Create a Home Valuation Report for This Property
The Home Valuation Report is an in-depth analysis detailing your home's value as well as a comparison with similar homes in the area
Home Values in the Area
Average Home Value in this Area
Purchase History
| Date | Buyer | Sale Price | Title Company |
|---|---|---|---|
| Spriggs Linda | -- | -- | |
| Spriggs Michael W | -- | -- | |
| Spriggs Linda | -- | -- |
Source: Public Records
Mortgage History
| Date | Status | Borrower | Loan Amount |
|---|---|---|---|
| Closed | Spriggs Michael W | $79,414 |
Source: Public Records
Tax History Compared to Growth
Tax History
| Year | Tax Paid | Tax Assessment Tax Assessment Total Assessment is a certain percentage of the fair market value that is determined by local assessors to be the total taxable value of land and additions on the property. | Land | Improvement |
|---|---|---|---|---|
| 2024 | $3,169 | $55,407 | $9,270 | $46,137 |
| 2023 | $3,783 | $49,606 | $8,299 | $41,307 |
| 2022 | $3,783 | $49,694 | $7,646 | $42,048 |
| 2021 | $3,285 | $42,507 | $6,532 | $35,975 |
| 2020 | $3,242 | $39,600 | $6,085 | $33,515 |
| 2019 | $3,166 | $36,287 | $5,576 | $30,711 |
| 2018 | $3,527 | $33,658 | $7,176 | $26,482 |
| 2017 | $3,382 | $29,778 | $6,349 | $23,429 |
| 2016 | $3,071 | $25,876 | $5,517 | $20,359 |
| 2015 | $2,899 | $23,160 | $4,938 | $18,222 |
| 2014 | $2,823 | $22,225 | $5,111 | $17,114 |
| 2012 | $3,719 | $24,079 | $5,538 | $18,541 |
Source: Public Records
Map
Nearby Homes
- 24 Washington Terrace
- 102 Baldwin Ave
- 0 Brookside Ave
- 3170 W Monroe St Unit 309
- 2726 W Hidden Glen Dr
- 12601 W Atlantic Ave
- 2116 & 2101 Williamsburg Dr
- 621 N Austin Ave
- 34887 N Austin Ave
- 603 N Austin Ave
- 615 Tiffany Dr
- 49 S Lewis Ave
- 525 Lawrence Ave
- 3027 Belvidere Rd
- 132 Dorchester Ct
- 12698 W Grandview Ave
- 12716 W Grandview Ave
- 1213 Grand Ave
- 3482 Ellis Ave
- 3210 W Grandview Ave
- 26 N Pioneer Rd
- 22 N Pioneer Rd
- 20 N Pioneer Rd
- 25 N Metropolitan Ave
- 2801 W Cornelia Ave
- 2805 W Cornelia Ave
- 21 N Metropolitan Ave
- 18 N Pioneer Rd
- 29 N Metropolitan Ave
- 27 N Pioneer Rd
- 23 N Pioneer Rd
- 2815 W Cornelia Ave
- 16 N Pioneer Rd
- 21 N Pioneer Rd
- 29 N Pioneer Rd
- 19 N Pioneer Rd
- 31 N Pioneer Rd
- 2800 W Cornelia Ave
- 17 N Pioneer Rd
- 22 Washington Terrace