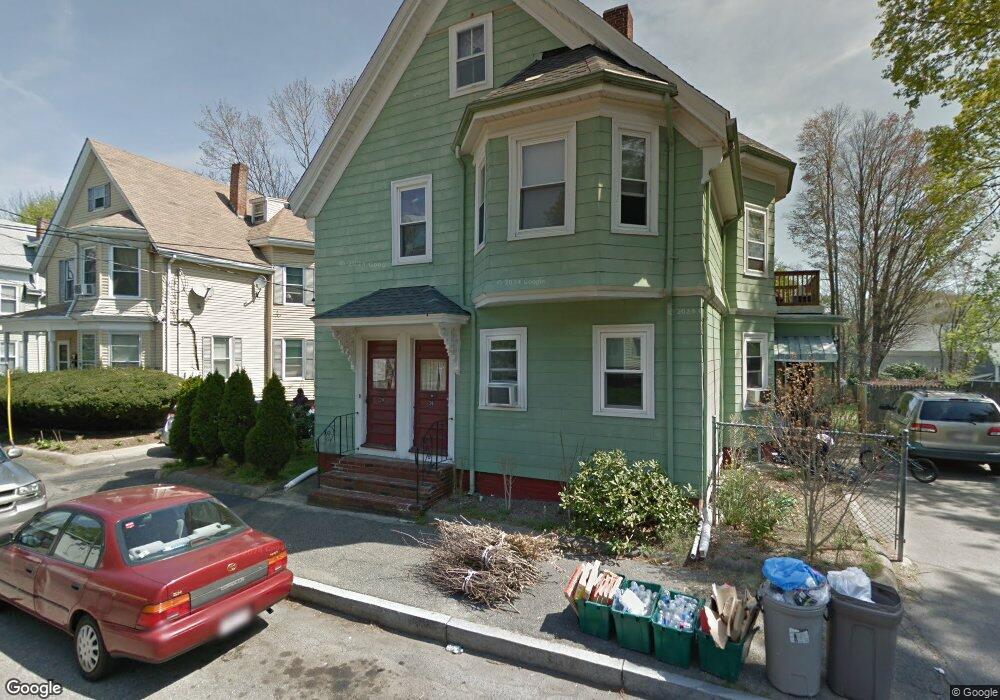
24 Nason St Brockton, MA 02301
Clifton Heights NeighborhoodEstimated Value: $660,166 - $782,000
5
Beds
2
Baths
2,513
Sq Ft
$283/Sq Ft
Est. Value
About This Home
This home is located at 24 Nason St, Brockton, MA 02301 and is currently estimated at $711,292, approximately $283 per square foot. 24 Nason St is a home located in Plymouth County with nearby schools including John F. Kennedy Elementary School, Davis K-8 School, and South Middle School.
Ownership History
Date
Name
Owned For
Owner Type
Purchase Details
Closed on
Apr 27, 2007
Sold by
Yang La
Bought by
Khang Yee and Yang La
Current Estimated Value
Home Financials for this Owner
Home Financials are based on the most recent Mortgage that was taken out on this home.
Original Mortgage
$7,223
Outstanding Balance
$4,353
Interest Rate
6.18%
Mortgage Type
Purchase Money Mortgage
Estimated Equity
$706,939
Purchase Details
Closed on
Feb 17, 1995
Sold by
Diversified Group Fund
Bought by
Yang La and Cha Pa
Home Financials for this Owner
Home Financials are based on the most recent Mortgage that was taken out on this home.
Original Mortgage
$63,446
Interest Rate
9.19%
Mortgage Type
Purchase Money Mortgage
Purchase Details
Closed on
Sep 19, 1994
Sold by
Francois Leonidas E and Francois Marie R
Bought by
Somario Stephen R
Purchase Details
Closed on
Oct 16, 1990
Sold by
Viscardi Peter
Bought by
Francois Leonidas E
Create a Home Valuation Report for This Property
The Home Valuation Report is an in-depth analysis detailing your home's value as well as a comparison with similar homes in the area
Home Values in the Area
Average Home Value in this Area
Purchase History
| Date | Buyer | Sale Price | Title Company |
|---|---|---|---|
| Khang Yee | -- | -- | |
| Khang Yee | -- | -- | |
| Yang La | $63,500 | -- | |
| Somario Stephen R | $52,000 | -- | |
| Francois Leonidas E | $165,000 | -- |
Source: Public Records
Mortgage History
| Date | Status | Borrower | Loan Amount |
|---|---|---|---|
| Open | Francois Leonidas E | $7,223 | |
| Closed | Francois Leonidas E | $7,223 | |
| Previous Owner | Francois Leonidas E | $73,981 | |
| Previous Owner | Francois Leonidas E | $63,446 |
Source: Public Records
Tax History Compared to Growth
Tax History
| Year | Tax Paid | Tax Assessment Tax Assessment Total Assessment is a certain percentage of the fair market value that is determined by local assessors to be the total taxable value of land and additions on the property. | Land | Improvement |
|---|---|---|---|---|
| 2025 | $7,775 | $642,000 | $140,300 | $501,700 |
| 2024 | $7,491 | $623,200 | $140,300 | $482,900 |
| 2023 | $6,561 | $505,500 | $105,400 | $400,100 |
| 2022 | $6,351 | $454,600 | $95,800 | $358,800 |
| 2021 | $5,923 | $408,500 | $79,800 | $328,700 |
| 2020 | $5,763 | $380,400 | $74,500 | $305,900 |
| 2019 | $5,055 | $325,300 | $72,700 | $252,600 |
| 2018 | $4,860 | $302,600 | $72,700 | $229,900 |
| 2017 | $4,556 | $283,000 | $72,700 | $210,300 |
| 2016 | $4,548 | $262,000 | $70,500 | $191,500 |
| 2015 | $3,628 | $199,900 | $70,500 | $129,400 |
| 2014 | $3,523 | $194,300 | $70,500 | $123,800 |
Source: Public Records
Map
Nearby Homes
- 20 Nason St
- 139 Tribou St
- 145 Tribou St Unit 2
- 145 Tribou St Unit 1
- 145 Tribou St
- 14 Nason St
- 2 Linnea Ave
- 133 Tribou St
- 15 Menlo Place
- 4 Linnea Ave
- 10 Nason St
- 17 Nason St
- 17 Nason St Unit 17A
- 157 Tribou St
- 129 Tribou St
- 8 Linnea Ave
- 144 Tribou St
- 144 Tribou St Unit 1
- 144 Tribou St Unit 2
- 146 Tribou St