Estimated Value: $261,000 - $344,000
3
Beds
2
Baths
1,376
Sq Ft
$232/Sq Ft
Est. Value
About This Home
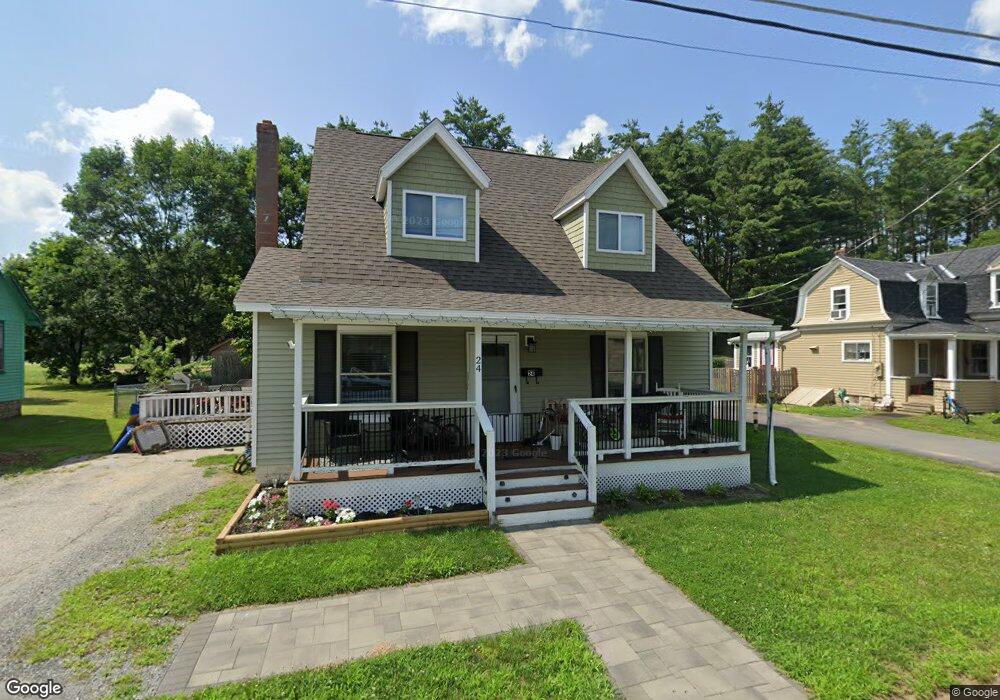
This home is located at 24 Newman St, Keene, NH 03431 and is currently estimated at $319,423, approximately $232 per square foot. 24 Newman St is a home located in Cheshire County with nearby schools including Keene Middle School, Keene High School, and Gathering Waters Charter School (H).
Ownership History
Date
Name
Owned For
Owner Type
Purchase Details
Closed on
May 11, 2010
Sold by
Fnma
Bought by
Wilder Kevin A
Current Estimated Value
Home Financials for this Owner
Home Financials are based on the most recent Mortgage that was taken out on this home.
Original Mortgage
$138,446
Outstanding Balance
$92,704
Interest Rate
5.03%
Mortgage Type
Purchase Money Mortgage
Estimated Equity
$226,719
Purchase Details
Closed on
Mar 4, 2010
Sold by
Amadon Gary W and Fnma
Bought by
Federal National Mortgage Association
Create a Home Valuation Report for This Property
The Home Valuation Report is an in-depth analysis detailing your home's value as well as a comparison with similar homes in the area
Home Values in the Area
Average Home Value in this Area
Purchase History
| Date | Buyer | Sale Price | Title Company |
|---|---|---|---|
| Wilder Kevin A | $70,500 | -- | |
| Federal National Mortgage Association | $144,800 | -- |
Source: Public Records
Mortgage History
| Date | Status | Borrower | Loan Amount |
|---|---|---|---|
| Open | Federal National Mortgage Association | $138,446 |
Source: Public Records
Tax History Compared to Growth
Tax History
| Year | Tax Paid | Tax Assessment Tax Assessment Total Assessment is a certain percentage of the fair market value that is determined by local assessors to be the total taxable value of land and additions on the property. | Land | Improvement |
|---|---|---|---|---|
| 2024 | $6,363 | $192,400 | $43,400 | $149,000 |
| 2023 | $6,136 | $192,400 | $43,400 | $149,000 |
| 2022 | $5,970 | $192,400 | $43,400 | $149,000 |
| 2021 | $6,018 | $192,400 | $43,400 | $149,000 |
| 2020 | $5,133 | $137,700 | $50,600 | $87,100 |
| 2019 | $5,178 | $137,700 | $50,600 | $87,100 |
| 2018 | $5,111 | $137,700 | $50,600 | $87,100 |
| 2017 | $5,151 | $138,400 | $51,300 | $87,100 |
| 2016 | $5,036 | $138,400 | $51,300 | $87,100 |
Source: Public Records
Map
Nearby Homes
- 7 Newman St
- 30 Nelson St
- 45 Blossom St
- 257 Park Ave
- 67 Woodburn St
- 89 Kendall Rd
- 66 Forest St
- 50 Forest St
- 0 Stevens St Unit 1
- 91 Carroll St
- 23 Base Hill Rd
- 232 Winchester St
- 110 Arch St Unit 27
- 110 Arch St Unit 42
- 123 Howard St
- 29 Windsor Ct Unit K
- 11 Nut Hatch Ln
- 00 Gilsum St
- 39 Windsor Ct Unit B
- 37 Church St Unit 3