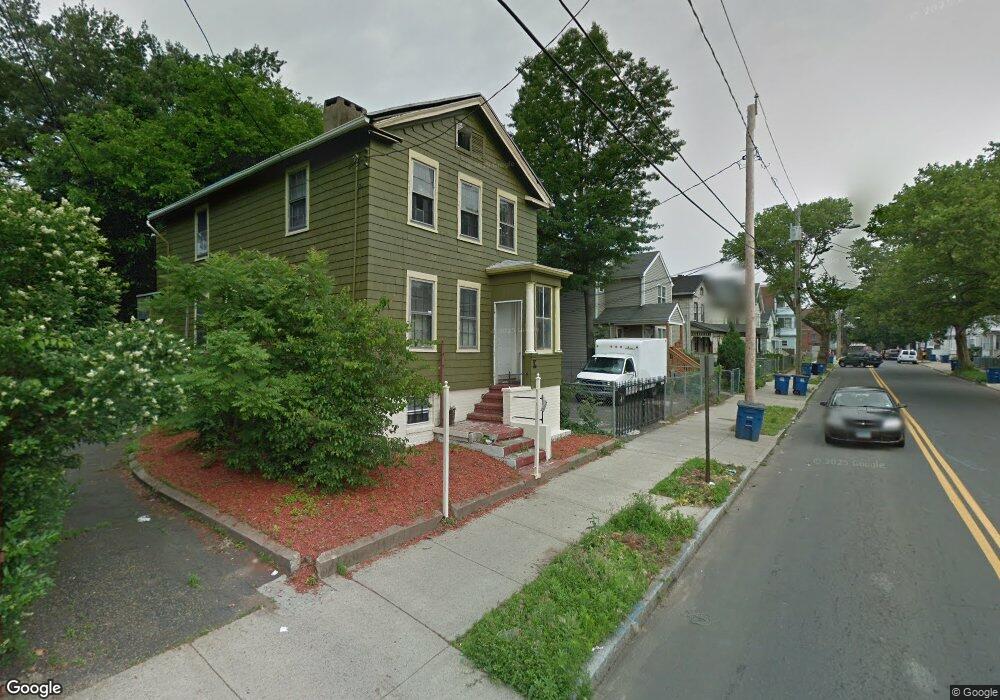
24 Orchard St New Haven, CT 06519
The Hill NeighborhoodEstimated Value: $311,000 - $568,000
6
Beds
5
Baths
2,572
Sq Ft
$167/Sq Ft
Est. Value
About This Home
This home is located at 24 Orchard St, New Haven, CT 06519 and is currently estimated at $430,173, approximately $167 per square foot. 24 Orchard St is a home located in New Haven County with nearby schools including St Martin De Porres Academy.
Ownership History
Date
Name
Owned For
Owner Type
Purchase Details
Closed on
Feb 22, 2017
Sold by
Willilams Tyrone and Williams Deborah A
Bought by
Williams Tyrone
Current Estimated Value
Purchase Details
Closed on
May 9, 1991
Sold by
Harambee Housing Corp
Bought by
Williams Tyrone and Williams Deborah
Home Financials for this Owner
Home Financials are based on the most recent Mortgage that was taken out on this home.
Original Mortgage
$107,000
Interest Rate
8.56%
Mortgage Type
Unknown
Create a Home Valuation Report for This Property
The Home Valuation Report is an in-depth analysis detailing your home's value as well as a comparison with similar homes in the area
Home Values in the Area
Average Home Value in this Area
Purchase History
| Date | Buyer | Sale Price | Title Company |
|---|---|---|---|
| Williams Tyrone | -- | -- | |
| Williams Tyrone | $127,000 | -- |
Source: Public Records
Mortgage History
| Date | Status | Borrower | Loan Amount |
|---|---|---|---|
| Previous Owner | Williams Tyrone | $172,000 | |
| Previous Owner | Williams Tyrone | $107,000 | |
| Previous Owner | Williams Tyrone | $135,000 | |
| Closed | Williams Tyrone | $21,000 |
Source: Public Records
Tax History
| Year | Tax Paid | Tax Assessment Tax Assessment Total Assessment is a certain percentage of the fair market value that is determined by local assessors to be the total taxable value of land and additions on the property. | Land | Improvement |
|---|---|---|---|---|
| 2025 | $7,813 | $198,310 | $38,290 | $160,020 |
| 2024 | $7,635 | $198,310 | $38,290 | $160,020 |
| 2023 | $7,377 | $198,310 | $38,290 | $160,020 |
| 2022 | $7,883 | $198,310 | $38,290 | $160,020 |
| 2021 | $5,157 | $117,530 | $33,740 | $83,790 |
| 2020 | $5,157 | $117,530 | $33,740 | $83,790 |
| 2019 | $5,051 | $117,530 | $33,740 | $83,790 |
| 2018 | $5,051 | $117,530 | $33,740 | $83,790 |
| 2017 | $4,546 | $117,530 | $33,740 | $83,790 |
| 2016 | $3,522 | $84,770 | $12,250 | $72,520 |
| 2015 | $3,522 | $84,770 | $12,250 | $72,520 |
| 2014 | $3,522 | $84,770 | $12,250 | $72,520 |
Source: Public Records
Map
Nearby Homes
- 231 Davenport Ave
- 22 Stevens St
- 282 Davenport Ave
- 52 Ann St
- 87 Orchard St
- 84 Sylvan Ave
- 65 Stevens St
- 212 West St
- 163 West St
- 83 Winthrop Ave
- 156 West St
- 840 Congress Ave
- 31 Greenwood St
- 38 Hallock St
- 46 Frank St
- 95 Frank St
- 100 York St Unit 12-E
- 100 York St Unit 3B
- 100 York St Unit 5-D
- 100 York St Unit 9-C
- 32 Orchard St
- 20 Orchard St
- 28 Orchard St
- 36 Orchard St
- 14 Orchard St
- 231 Davenport Ave Unit BASEMENT
- 231 Davenport Ave Unit 3
- 231 Davenport Ave Unit 2
- 231 Davenport Ave Unit 1
- 227 Davenport Ave
- 19 Stevens St
- 40 Orchard St
- 21 Stevens St
- 15 Stevens St
- 23 Stevens St
- 4 Orchard St
- 25 Stevens St
- 13 Stevens St
- 42 Orchard St
- 27 Stevens St
Your Personal Tour Guide
Ask me questions while you tour the home.