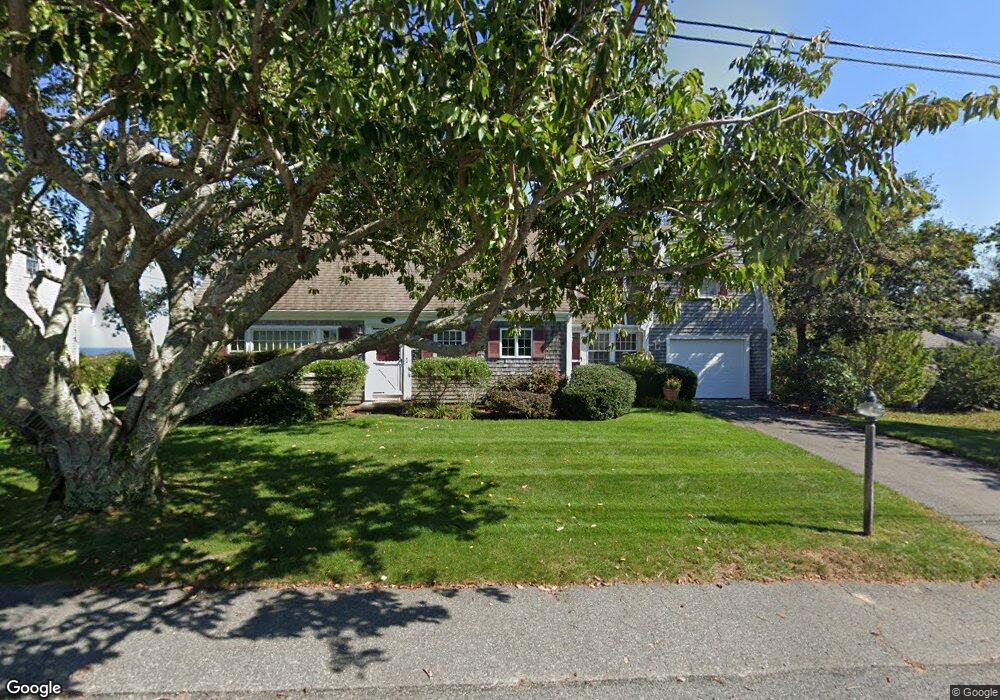
24 Paul St Dennis, MA 02638
Dennis Village NeighborhoodEstimated Value: $1,467,000 - $1,832,361
4
Beds
3
Baths
2,277
Sq Ft
$738/Sq Ft
Est. Value
About This Home
This home is located at 24 Paul St, Dennis, MA 02638 and is currently estimated at $1,679,840, approximately $737 per square foot. 24 Paul St is a home located in Barnstable County with nearby schools including Dennis-Yarmouth Regional High School.
Ownership History
Date
Name
Owned For
Owner Type
Purchase Details
Closed on
Jun 4, 2024
Sold by
Bowlin Nancy R
Bought by
Obrien Robin G and Rossel Robert T
Current Estimated Value
Purchase Details
Closed on
Apr 18, 2024
Sold by
Robert E Rossel Ret and Rossel Obrien
Bought by
Rossel-Obrien Robin G and Bowlin Nancy R
Create a Home Valuation Report for This Property
The Home Valuation Report is an in-depth analysis detailing your home's value as well as a comparison with similar homes in the area
Home Values in the Area
Average Home Value in this Area
Purchase History
| Date | Buyer | Sale Price | Title Company |
|---|---|---|---|
| Obrien Robin G | $500,000 | None Available | |
| Obrien Robin G | $500,000 | None Available | |
| Rossel-Obrien Robin G | -- | None Available | |
| Rossel-Obrien Robin G | -- | None Available | |
| Robert E Rossel Ret | -- | None Available | |
| Robert E Rossel Ret | -- | None Available | |
| Rossel-Obrien Robin G | -- | None Available |
Source: Public Records
Tax History Compared to Growth
Tax History
| Year | Tax Paid | Tax Assessment Tax Assessment Total Assessment is a certain percentage of the fair market value that is determined by local assessors to be the total taxable value of land and additions on the property. | Land | Improvement |
|---|---|---|---|---|
| 2025 | $7,334 | $1,693,800 | $1,089,200 | $604,600 |
| 2024 | $7,168 | $1,632,800 | $1,047,500 | $585,300 |
| 2023 | $6,932 | $1,484,300 | $952,200 | $532,100 |
| 2022 | $6,001 | $1,071,600 | $674,000 | $397,600 |
| 2021 | $6,056 | $1,004,300 | $660,700 | $343,600 |
| 2020 | $6,006 | $984,600 | $660,700 | $323,900 |
| 2019 | $4,687 | $759,600 | $471,100 | $288,500 |
| 2018 | $4,782 | $754,200 | $482,100 | $272,100 |
| 2017 | $4,638 | $754,200 | $482,100 | $272,100 |
| 2016 | $4,903 | $750,900 | $527,000 | $223,900 |
| 2015 | $4,663 | $728,600 | $527,000 | $201,600 |
| 2014 | $4,586 | $722,200 | $527,000 | $195,200 |
Source: Public Records
Map
Nearby Homes
- 4 Maureens Way
- 831 Main St
- 1376 Bridge St Unit 16
- 13 Hayfield Rd
- 13 Hayfield Rd
- 59 Hope Ln
- 19 Deacon Joseph Ln
- 645 Main St Back Lot
- 35 Crown Grant Dr
- 73 Pilgrim Rd
- 19 Whig St
- 15 Signal Hill Dr
- 6 Thomas Ct
- 7 Dolphin Way
- 37 Johnson Ln
- 96 Shore Dr
- 11 Island Creek Ln
- 32 Captain Walsh Dr
- 15 Trudy Cir
- 268 Main St