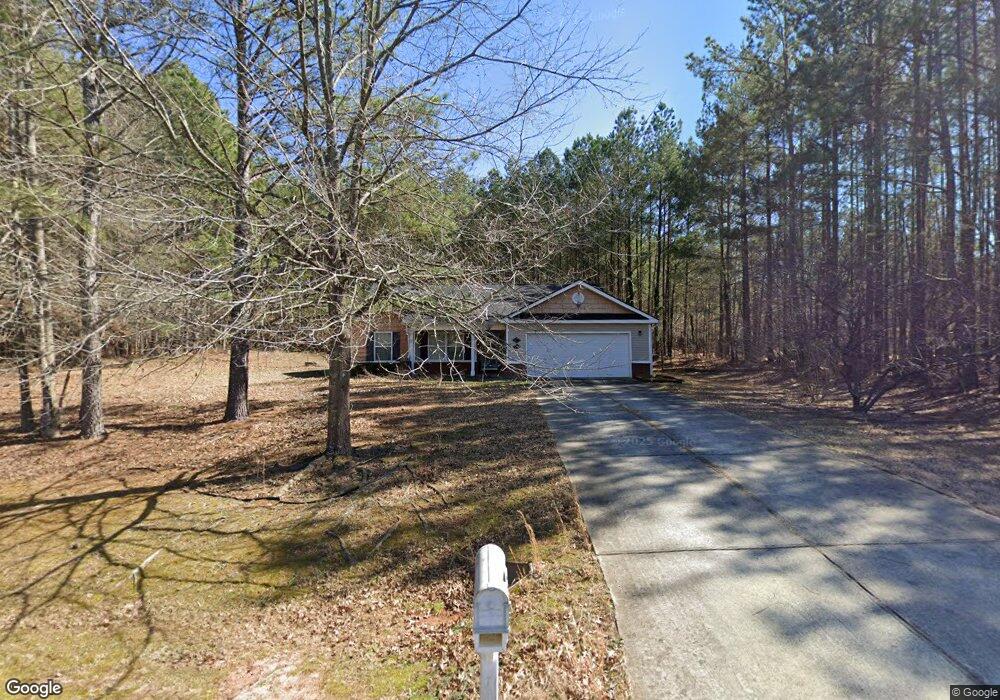
24 Pineview Ct Colbert, GA 30628
Highlights
- Vaulted Ceiling
- 1 Fireplace
- Screened Porch
- Oglethorpe County Middle School Rated A-
- No HOA
- 2 Car Attached Garage
About This Home
As of April 2023Pinewood Hills is a family friendly 3/2 on 1.9 acres on small cul de sac, just minutes from Athens in Oglethorpe County. The rocking-chair covered front porch welcomes you to this home. The front door opens to find an expansive, bright living room. A vaulted ceiling and a beautiful brick framed fireplace are the focal point. This roomy relaxing space is a great place to enjoy a Friday night family gathering, watch movies or just sit and unwind after work. An open floor plan with eat-in kitchen. formal dining room as well. You will enjoy the abundant counter and cabinet space and a convenient pantry closet. The chair rail and picture frame molding details add charm and elegance to the space. Laminate flooring for easy care. Master bedroom has a nice master bath with dual sinks and seperate shower. The additional bedrooms are split from master. Very nice home and ready for new owners.
Home Details
Home Type
- Single Family
Est. Annual Taxes
- $1,387
Year Built
- Built in 2004
Parking
- 2 Car Attached Garage
Home Design
- Vinyl Siding
Interior Spaces
- 1-Story Property
- Vaulted Ceiling
- 1 Fireplace
- Screened Porch
- Home Security System
Kitchen
- Range<<rangeHoodToken>>
- Dishwasher
Flooring
- Carpet
- Tile
- Vinyl
Bedrooms and Bathrooms
- 3 Bedrooms
- 2 Full Bathrooms
Schools
- Oglethorpe County Elementary School
- Oglethorpe County Middle School
- Oglethorpe County High School
Utilities
- Cooling Available
- Central Heating
- Heat Pump System
- Septic Tank
Community Details
- No Home Owners Association
- Pinewood Hills Subdivision
Listing and Financial Details
- Assessor Parcel Number 021 118 20 A
Ownership History
Purchase Details
Home Financials for this Owner
Home Financials are based on the most recent Mortgage that was taken out on this home.Purchase Details
Home Financials for this Owner
Home Financials are based on the most recent Mortgage that was taken out on this home.Purchase Details
Home Financials for this Owner
Home Financials are based on the most recent Mortgage that was taken out on this home.Purchase Details
Purchase Details
Home Financials for this Owner
Home Financials are based on the most recent Mortgage that was taken out on this home.Purchase Details
Home Financials for this Owner
Home Financials are based on the most recent Mortgage that was taken out on this home.Purchase Details
Purchase Details
Home Values in the Area
Average Home Value in this Area
Purchase History
| Date | Type | Sale Price | Title Company |
|---|---|---|---|
| Warranty Deed | $277,000 | -- | |
| Warranty Deed | $186,000 | -- | |
| Warranty Deed | $131,000 | -- | |
| Warranty Deed | -- | -- | |
| Deed | $123,000 | -- | |
| Deed | $120,000 | -- | |
| Deed | $113,000 | -- | |
| Deed | $660,000 | -- |
Mortgage History
| Date | Status | Loan Amount | Loan Type |
|---|---|---|---|
| Open | $271,982 | FHA | |
| Previous Owner | $186,000 | New Conventional | |
| Previous Owner | $127,070 | New Conventional | |
| Previous Owner | $119,212 | FHA | |
| Previous Owner | $121,394 | FHA | |
| Previous Owner | $121,734 | FHA | |
| Previous Owner | $13,366 | New Conventional | |
| Previous Owner | $109,531 | New Conventional | |
| Previous Owner | $120,000 | New Conventional |
Property History
| Date | Event | Price | Change | Sq Ft Price |
|---|---|---|---|---|
| 04/10/2023 04/10/23 | Sold | $277,000 | +3.0% | $212 / Sq Ft |
| 03/11/2023 03/11/23 | Pending | -- | -- | -- |
| 01/27/2023 01/27/23 | For Sale | $269,000 | +44.6% | $206 / Sq Ft |
| 04/07/2021 04/07/21 | Sold | $186,000 | +0.5% | $142 / Sq Ft |
| 03/10/2021 03/10/21 | For Sale | $185,000 | +41.2% | $142 / Sq Ft |
| 06/02/2017 06/02/17 | Sold | $131,000 | -2.9% | $100 / Sq Ft |
| 05/03/2017 05/03/17 | Pending | -- | -- | -- |
| 03/07/2017 03/07/17 | For Sale | $134,900 | 0.0% | $103 / Sq Ft |
| 02/07/2014 02/07/14 | Rented | -- | -- | -- |
| 01/08/2014 01/08/14 | Under Contract | -- | -- | -- |
| 09/24/2013 09/24/13 | For Rent | -- | -- | -- |
Tax History Compared to Growth
Tax History
| Year | Tax Paid | Tax Assessment Tax Assessment Total Assessment is a certain percentage of the fair market value that is determined by local assessors to be the total taxable value of land and additions on the property. | Land | Improvement |
|---|---|---|---|---|
| 2024 | $2,099 | $88,080 | $12,000 | $76,080 |
| 2023 | $2,310 | $91,960 | $12,000 | $79,960 |
| 2022 | $1,732 | $69,400 | $8,000 | $61,400 |
| 2021 | $1,518 | $54,880 | $8,000 | $46,880 |
| 2020 | $1,159 | $54,880 | $8,000 | $46,880 |
| 2019 | $1,530 | $54,880 | $8,000 | $46,880 |
| 2018 | $1,418 | $46,953 | $10,260 | $36,693 |
| 2017 | $1,418 | $46,953 | $10,260 | $36,693 |
| 2016 | $1,386 | $46,953 | $10,260 | $36,693 |
| 2015 | -- | $46,953 | $10,260 | $36,693 |
| 2014 | -- | $46,953 | $10,260 | $36,693 |
| 2013 | -- | $46,952 | $10,260 | $36,692 |
Map
Source: Savannah Multi-List Corporation
MLS Number: CM954949
APN: 021-118-20A
Disclaimer: Certain information contained herein is derived from information provided by parties other than Homes.com. All information provided is deemed reliable, but is not guaranteed to be accurate and should be independently verified.
![]() IDX information is provided exclusively for personal, non-commercial use, and may not be used for any purpose other than to identify prospective properties consumers may be interested in purchasing.
IDX information is provided exclusively for personal, non-commercial use, and may not be used for any purpose other than to identify prospective properties consumers may be interested in purchasing.
Information is deemed reliable but not guaranteed.