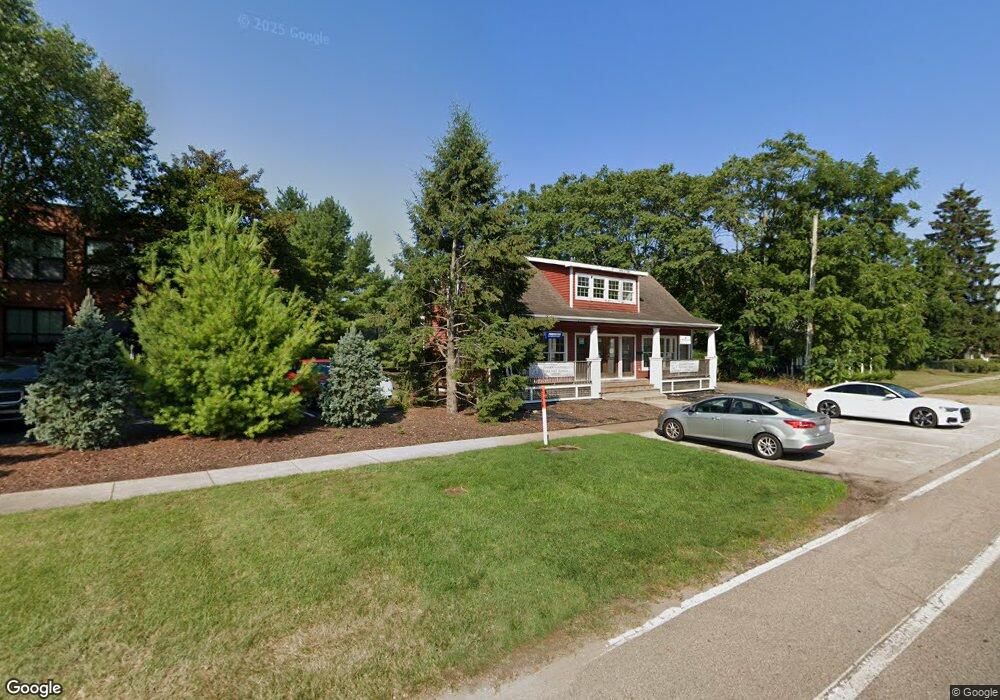
24 Pond Path New Buffalo, MI 49117
Estimated Value: $615,888 - $952,000
4
Beds
2
Baths
2,000
Sq Ft
$385/Sq Ft
Est. Value
About This Home
This home is located at 24 Pond Path, New Buffalo, MI 49117 and is currently estimated at $769,972, approximately $384 per square foot. 24 Pond Path is a home located in Berrien County with nearby schools including New Buffalo Elementary School, New Buffalo Middle School, and New Buffalo Senior High School.
Ownership History
Date
Name
Owned For
Owner Type
Purchase Details
Closed on
Jul 15, 2024
Sold by
Oleary James D and Maras Catherine
Bought by
Maras-Oleary Living Trust and Oleary
Current Estimated Value
Purchase Details
Closed on
Feb 10, 2021
Sold by
Oleary James D and Maras Catherine
Bought by
Oleary James D and Maras Catherine
Home Financials for this Owner
Home Financials are based on the most recent Mortgage that was taken out on this home.
Original Mortgage
$208,911
Interest Rate
2.65%
Mortgage Type
New Conventional
Purchase Details
Closed on
Feb 21, 2003
Sold by
Bella Vita Llc
Bought by
Oleary James D and Oleary Catherine Maras
Home Financials for this Owner
Home Financials are based on the most recent Mortgage that was taken out on this home.
Original Mortgage
$269,000
Interest Rate
5.71%
Mortgage Type
Purchase Money Mortgage
Create a Home Valuation Report for This Property
The Home Valuation Report is an in-depth analysis detailing your home's value as well as a comparison with similar homes in the area
Purchase History
| Date | Buyer | Sale Price | Title Company |
|---|---|---|---|
| Maras-Oleary Living Trust | -- | None Listed On Document | |
| Oleary James D | -- | None Available | |
| Oleary James D | -- | -- |
Source: Public Records
Mortgage History
| Date | Status | Borrower | Loan Amount |
|---|---|---|---|
| Previous Owner | Oleary James D | $208,911 | |
| Previous Owner | Oleary James D | $269,000 |
Source: Public Records
Tax History
| Year | Tax Paid | Tax Assessment Tax Assessment Total Assessment is a certain percentage of the fair market value that is determined by local assessors to be the total taxable value of land and additions on the property. | Land | Improvement |
|---|---|---|---|---|
| 2025 | $4,717 | $275,200 | $0 | $0 |
| 2024 | $3,608 | $276,600 | $0 | $0 |
| 2023 | $3,480 | $267,200 | $0 | $0 |
| 2022 | $3,314 | $170,000 | $0 | $0 |
| 2021 | $4,221 | $161,200 | $33,900 | $127,300 |
| 2020 | $4,173 | $164,100 | $0 | $0 |
| 2019 | $4,139 | $160,500 | $33,900 | $126,600 |
Source: Public Records
Map
Nearby Homes
- 312 S Whittaker St
- 318 S Whittaker St
- 208 S Barker St
- 221 S Whittaker St
- 309 S Whittaker St
- 310 W Detroit St
- 131 S Mayhew St
- 106 W Washington St
- 19175 U S 12
- 19747 U S 12
- 84 Harbor Landing
- 321 S Taylor St
- Lots 5 & 6 N Thompson
- Lots 3 & 4 N Thompson St
- 4202 Grand Bch Rd
- 217 W Merchant St
- Lots 7 & 8 N Whittaker
- 120 N Barton St Unit B
- 721 W Michigan St
- 321 E Merchant St
Your Personal Tour Guide
Ask me questions while you tour the home.