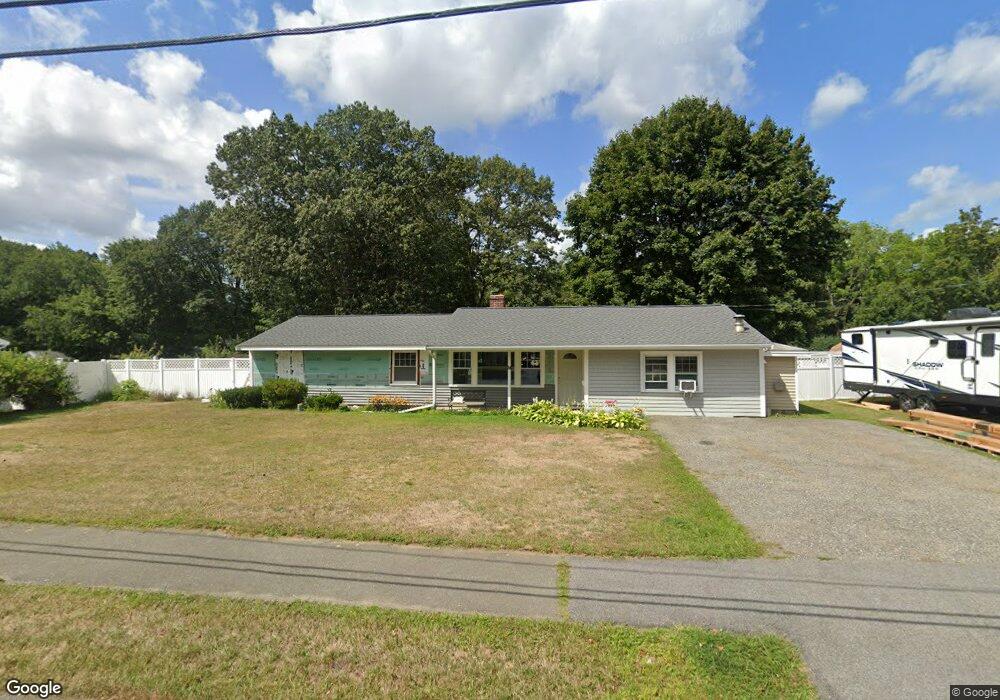
24 Princeton St Danvers, MA 01923
Estimated Value: $663,481 - $684,000
2
Beds
2
Baths
1,560
Sq Ft
$432/Sq Ft
Est. Value
About This Home
This home is located at 24 Princeton St, Danvers, MA 01923 and is currently estimated at $674,120, approximately $432 per square foot. 24 Princeton St is a home located in Essex County with nearby schools including Danvers High School, St. Mary of the Annunciation School, and North Shore Christian School.
Ownership History
Date
Name
Owned For
Owner Type
Purchase Details
Closed on
Aug 6, 2002
Sold by
Joyce John H and Joyce Melanie
Bought by
Mcguirk John B and Allen-Mcguirk Jane
Current Estimated Value
Home Financials for this Owner
Home Financials are based on the most recent Mortgage that was taken out on this home.
Original Mortgage
$280,250
Interest Rate
6.64%
Mortgage Type
Purchase Money Mortgage
Purchase Details
Closed on
Feb 26, 1999
Sold by
Costello George C and Costello Rita May
Bought by
Joyce John H and Joyce Melanie J
Home Financials for this Owner
Home Financials are based on the most recent Mortgage that was taken out on this home.
Original Mortgage
$168,610
Interest Rate
6.78%
Mortgage Type
Purchase Money Mortgage
Create a Home Valuation Report for This Property
The Home Valuation Report is an in-depth analysis detailing your home's value as well as a comparison with similar homes in the area
Home Values in the Area
Average Home Value in this Area
Purchase History
| Date | Buyer | Sale Price | Title Company |
|---|---|---|---|
| Mcguirk John B | $295,000 | -- | |
| Joyce John H | $170,000 | -- |
Source: Public Records
Mortgage History
| Date | Status | Borrower | Loan Amount |
|---|---|---|---|
| Open | Joyce John H | $277,000 | |
| Closed | Joyce John H | $280,250 | |
| Previous Owner | Joyce John H | $168,610 |
Source: Public Records
Tax History
| Year | Tax Paid | Tax Assessment Tax Assessment Total Assessment is a certain percentage of the fair market value that is determined by local assessors to be the total taxable value of land and additions on the property. | Land | Improvement |
|---|---|---|---|---|
| 2025 | $6,751 | $614,300 | $405,600 | $208,700 |
| 2024 | $6,733 | $606,000 | $405,600 | $200,400 |
| 2023 | $6,533 | $556,000 | $368,600 | $187,400 |
| 2022 | $6,393 | $505,000 | $334,500 | $170,500 |
| 2021 | $6,150 | $460,700 | $316,800 | $143,900 |
| 2020 | $6,051 | $463,300 | $313,100 | $150,200 |
| 2019 | $5,757 | $433,500 | $284,600 | $148,900 |
| 2018 | $5,597 | $413,400 | $281,800 | $131,600 |
| 2017 | $5,334 | $375,900 | $246,200 | $129,700 |
| 2016 | $5,086 | $358,200 | $234,800 | $123,400 |
| 2015 | $4,837 | $324,400 | $213,500 | $110,900 |
Source: Public Records
Map
Nearby Homes
Your Personal Tour Guide
Ask me questions while you tour the home.