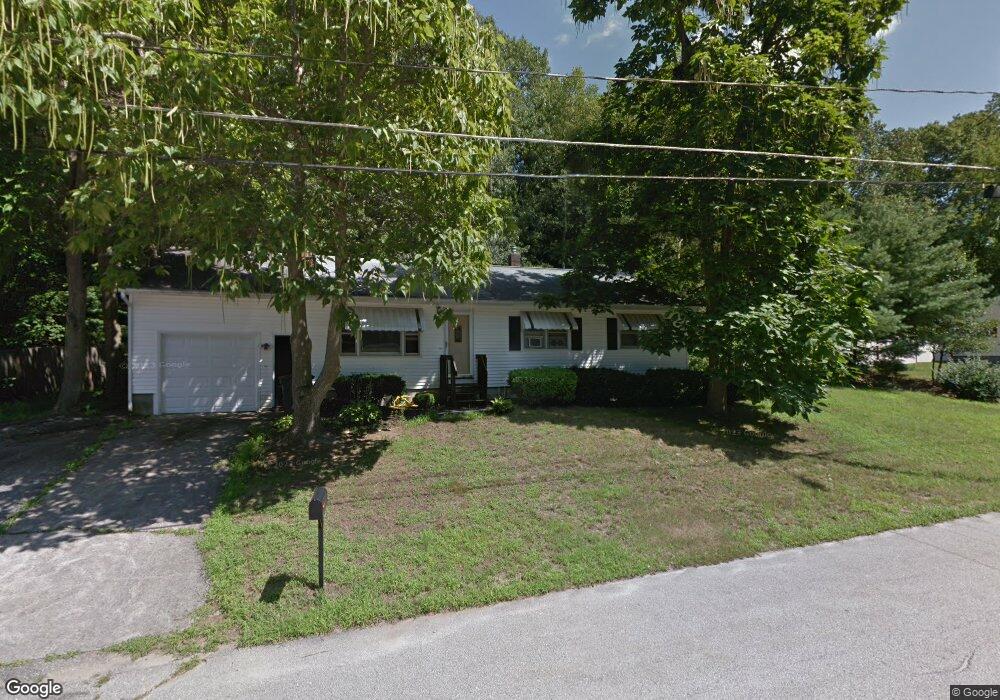
24 Raleigh Dr Nashua, NH 03062
Southwest Nashua NeighborhoodEstimated Value: $443,000 - $478,077
3
Beds
1
Bath
1,056
Sq Ft
$439/Sq Ft
Est. Value
About This Home
This home is located at 24 Raleigh Dr, Nashua, NH 03062 and is currently estimated at $463,269, approximately $438 per square foot. 24 Raleigh Dr is a home located in Hillsborough County with nearby schools including Bicentennial Elementary School, Fairgrounds Middle School, and Nashua High School South.
Ownership History
Date
Name
Owned For
Owner Type
Purchase Details
Closed on
May 15, 2020
Sold by
Pauline L Fournier Ft and Grant
Bought by
Fournier-Monplaisir M A and Monplaisir M
Current Estimated Value
Home Financials for this Owner
Home Financials are based on the most recent Mortgage that was taken out on this home.
Original Mortgage
$199,820
Outstanding Balance
$176,291
Interest Rate
3.3%
Mortgage Type
New Conventional
Estimated Equity
$286,978
Purchase Details
Closed on
Oct 18, 2016
Sold by
Fournier Pauline L
Bought by
Pualine L Fournier Ft and Grant
Purchase Details
Closed on
Nov 19, 2015
Sold by
Fournier Pauline L
Bought by
Johanna L Fournier Ft and Grant
Purchase Details
Closed on
Aug 15, 1988
Bought by
Fournier Pauline L
Create a Home Valuation Report for This Property
The Home Valuation Report is an in-depth analysis detailing your home's value as well as a comparison with similar homes in the area
Home Values in the Area
Average Home Value in this Area
Purchase History
| Date | Buyer | Sale Price | Title Company |
|---|---|---|---|
| Fournier-Monplaisir M A | $206,000 | None Available | |
| Pualine L Fournier Ft | -- | -- | |
| Johanna L Fournier Ft | -- | -- | |
| Fournier Pauline L | -- | -- |
Source: Public Records
Mortgage History
| Date | Status | Borrower | Loan Amount |
|---|---|---|---|
| Open | Fournier-Monplaisir M A | $199,820 |
Source: Public Records
Tax History Compared to Growth
Tax History
| Year | Tax Paid | Tax Assessment Tax Assessment Total Assessment is a certain percentage of the fair market value that is determined by local assessors to be the total taxable value of land and additions on the property. | Land | Improvement |
|---|---|---|---|---|
| 2024 | $6,932 | $436,000 | $164,600 | $271,400 |
| 2023 | $6,586 | $361,300 | $131,700 | $229,600 |
| 2022 | $6,529 | $361,300 | $131,700 | $229,600 |
| 2021 | $5,805 | $250,000 | $87,800 | $162,200 |
| 2020 | $5,657 | $250,200 | $87,800 | $162,400 |
| 2019 | $5,444 | $250,200 | $87,800 | $162,400 |
| 2018 | $5,307 | $250,200 | $87,800 | $162,400 |
| 2017 | $4,898 | $189,900 | $75,100 | $114,800 |
| 2016 | $4,761 | $189,900 | $75,100 | $114,800 |
| 2015 | $4,590 | $187,100 | $72,300 | $114,800 |
| 2014 | $4,500 | $187,100 | $72,300 | $114,800 |
Source: Public Records
Map
Nearby Homes
- 5 Appaloosa Place
- 29 Dickens St
- 9 Byron Dr
- 125 Lille Rd
- 57 Wethersfield Rd
- 61 Spindlewick Dr
- 29 Greenwood Dr
- 285 E Dunstable Rd
- 17 Herrick St
- 23 Glen Dr
- 2 Wakefield Dr
- 10 Lamb Rd
- 15 Learned St Unit 123
- 31 Tenby Dr
- 15 Westray Dr
- 5 Wilderness Dr
- 6 Hayden St
- 59 Pike St
- 36 Eastman St Unit 26
- 84 Hawthorne Village Rd Unit U414