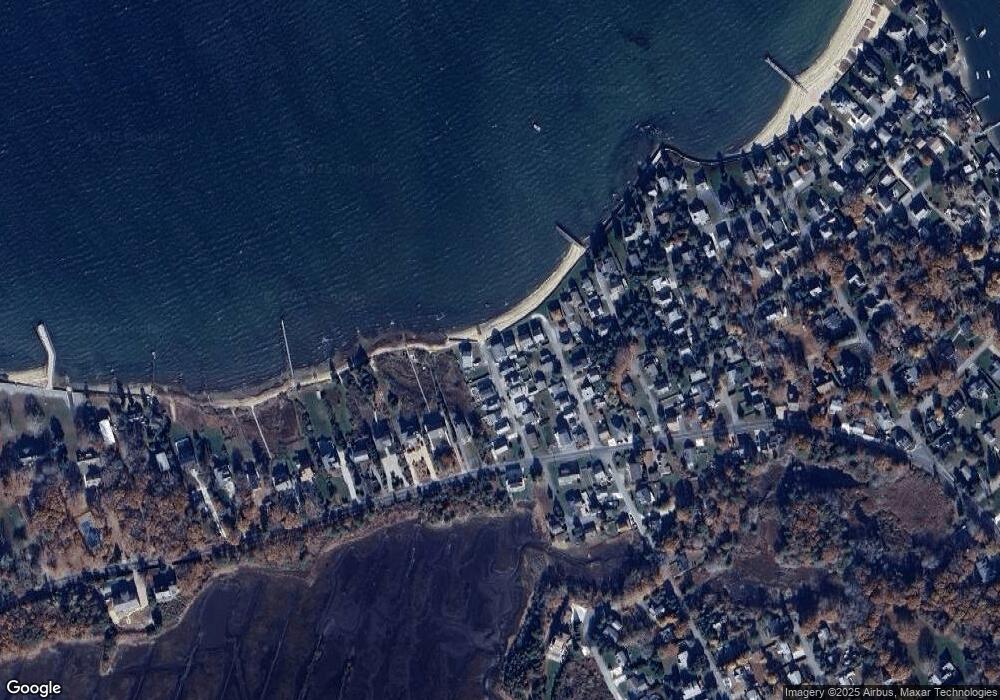
24 Richmond Rd Pocasset, MA 2559
Pocasset NeighborhoodEstimated Value: $1,502,000 - $1,599,000
5
Beds
2
Baths
2,208
Sq Ft
$701/Sq Ft
Est. Value
About This Home
This home is located at 24 Richmond Rd, Pocasset, MA 2559 and is currently estimated at $1,547,439, approximately $700 per square foot. 24 Richmond Rd is a home located in Barnstable County with nearby schools including Bourne High School and Cadence Academy Preschool - Bourne.
Ownership History
Date
Name
Owned For
Owner Type
Purchase Details
Closed on
Jan 29, 2020
Sold by
Silva Edward C and Silva Jennifer M
Bought by
Haron Charles D and Haron Mary
Current Estimated Value
Purchase Details
Closed on
Sep 17, 2018
Sold by
Silva Edward C
Bought by
Silva Edward C and Silva Jennifer M
Purchase Details
Closed on
Feb 16, 2017
Sold by
Silva Rt and Silva
Bought by
Silva Edward C
Purchase Details
Closed on
Jun 11, 2014
Sold by
Barrows Rt and Barrows
Bought by
Silva Rt and Silva
Create a Home Valuation Report for This Property
The Home Valuation Report is an in-depth analysis detailing your home's value as well as a comparison with similar homes in the area
Home Values in the Area
Average Home Value in this Area
Purchase History
| Date | Buyer | Sale Price | Title Company |
|---|---|---|---|
| Haron Charles D | $1,044,000 | None Available | |
| Haron Charles D | $1,044,000 | None Available | |
| Silva Edward C | -- | -- | |
| Silva Edward C | -- | -- | |
| Silva Edward C | -- | -- | |
| Silva Edward C | -- | -- | |
| Silva Rt | $479,000 | -- | |
| Silva Rt | $479,000 | -- |
Source: Public Records
Tax History Compared to Growth
Tax History
| Year | Tax Paid | Tax Assessment Tax Assessment Total Assessment is a certain percentage of the fair market value that is determined by local assessors to be the total taxable value of land and additions on the property. | Land | Improvement |
|---|---|---|---|---|
| 2025 | $9,035 | $1,156,900 | $662,700 | $494,200 |
| 2024 | $9,158 | $1,141,900 | $631,100 | $510,800 |
| 2023 | $8,903 | $1,010,500 | $558,500 | $452,000 |
| 2022 | $8,748 | $867,000 | $494,300 | $372,700 |
| 2021 | $7,273 | $675,300 | $404,800 | $270,500 |
| 2020 | $6,101 | $568,100 | $401,000 | $167,100 |
| 2019 | $5,871 | $558,600 | $401,000 | $157,600 |
| 2018 | $5,609 | $532,200 | $382,000 | $150,200 |
| 2017 | $5,390 | $523,300 | $378,300 | $145,000 |
| 2016 | $5,248 | $516,500 | $378,300 | $138,200 |
| 2015 | $5,201 | $516,500 | $378,300 | $138,200 |
Source: Public Records
Map
Nearby Homes