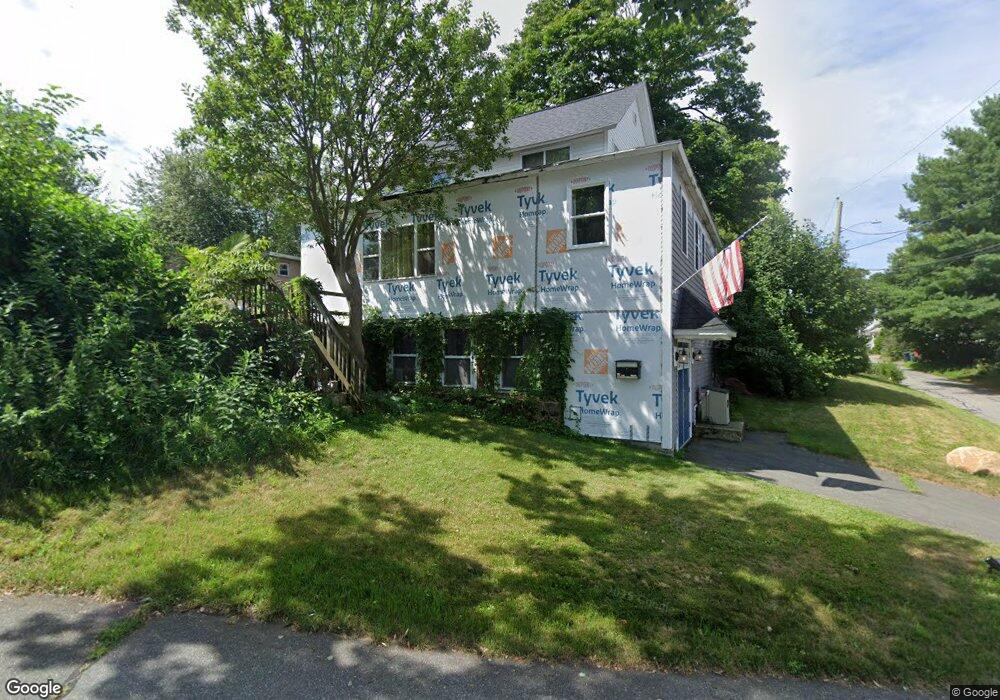
24 Rock Ave Warwick, RI 02889
Conimicut-Shawomet NeighborhoodEstimated Value: $371,891 - $415,000
3
Beds
2
Baths
1,380
Sq Ft
$285/Sq Ft
Est. Value
About This Home
This home is located at 24 Rock Ave, Warwick, RI 02889 and is currently estimated at $392,723, approximately $284 per square foot. 24 Rock Ave is a home located in Kent County with nearby schools including Saint Kevin School and Bishop Hendricken High School.
Ownership History
Date
Name
Owned For
Owner Type
Purchase Details
Closed on
Nov 22, 2022
Sold by
Bagian Ann E
Bought by
Bagian Ann E and Bagian David
Current Estimated Value
Purchase Details
Closed on
Jan 28, 2010
Sold by
Fnma
Bought by
Bagian Ann E
Home Financials for this Owner
Home Financials are based on the most recent Mortgage that was taken out on this home.
Original Mortgage
$127,500
Interest Rate
4.95%
Mortgage Type
Purchase Money Mortgage
Purchase Details
Closed on
Dec 3, 2009
Sold by
Goulin Lori J and Fnma
Bought by
Federal National Mortgage Association
Home Financials for this Owner
Home Financials are based on the most recent Mortgage that was taken out on this home.
Original Mortgage
$127,500
Interest Rate
4.95%
Mortgage Type
Purchase Money Mortgage
Purchase Details
Closed on
Dec 16, 1999
Sold by
Carani Anthony Est and Carani
Bought by
Mulhall Lori
Create a Home Valuation Report for This Property
The Home Valuation Report is an in-depth analysis detailing your home's value as well as a comparison with similar homes in the area
Home Values in the Area
Average Home Value in this Area
Purchase History
| Date | Buyer | Sale Price | Title Company |
|---|---|---|---|
| Bagian Ann E | -- | None Available | |
| Bagian Ann E | $150,000 | -- | |
| Federal National Mortgage Association | $248,394 | -- | |
| Mulhall Lori | $69,000 | -- |
Source: Public Records
Mortgage History
| Date | Status | Borrower | Loan Amount |
|---|---|---|---|
| Previous Owner | Mulhall Lori | $127,500 | |
| Previous Owner | Mulhall Lori | $274,500 | |
| Previous Owner | Mulhall Lori | $240,000 |
Source: Public Records
Tax History
| Year | Tax Paid | Tax Assessment Tax Assessment Total Assessment is a certain percentage of the fair market value that is determined by local assessors to be the total taxable value of land and additions on the property. | Land | Improvement |
|---|---|---|---|---|
| 2025 | $4,710 | $370,900 | $123,300 | $247,600 |
| 2024 | $4,235 | $292,700 | $102,100 | $190,600 |
| 2023 | $4,153 | $292,700 | $102,100 | $190,600 |
| 2022 | $3,956 | $211,200 | $64,600 | $146,600 |
| 2021 | $3,956 | $211,200 | $64,600 | $146,600 |
| 2020 | $3,956 | $211,200 | $64,600 | $146,600 |
| 2019 | $3,956 | $211,200 | $64,600 | $146,600 |
| 2018 | $2,914 | $140,100 | $61,600 | $78,500 |
| 2017 | $2,836 | $140,100 | $61,600 | $78,500 |
| 2016 | $2,836 | $140,100 | $61,600 | $78,500 |
| 2015 | $2,785 | $134,200 | $48,600 | $85,600 |
| 2014 | $2,692 | $134,200 | $48,600 | $85,600 |
| 2013 | $2,656 | $134,200 | $48,600 | $85,600 |
Source: Public Records
Map
Nearby Homes
Your Personal Tour Guide
Ask me questions while you tour the home.