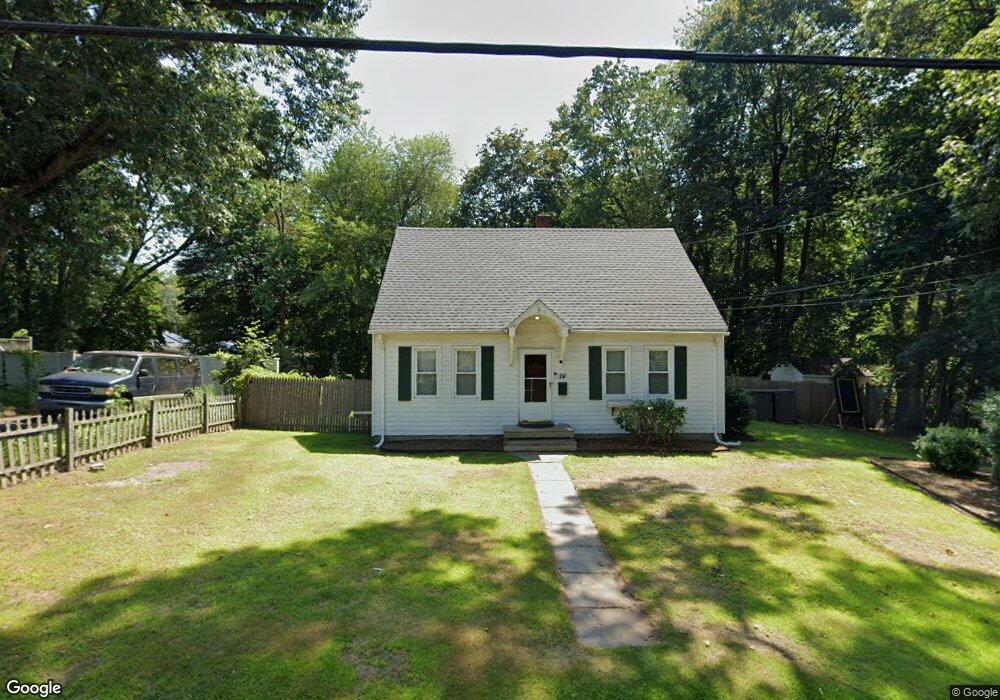
24 Roy St Enfield, CT 06082
Estimated Value: $305,564 - $334,000
3
Beds
2
Baths
1,476
Sq Ft
$217/Sq Ft
Est. Value
About This Home
This home is located at 24 Roy St, Enfield, CT 06082 and is currently estimated at $320,891, approximately $217 per square foot. 24 Roy St is a home located in Hartford County with nearby schools including Prudence Crandall Elementary School, Henry Barnard Elementary School, and Enfield High School.
Ownership History
Date
Name
Owned For
Owner Type
Purchase Details
Closed on
Dec 13, 2023
Sold by
Kane Robert E
Bought by
Kane Abbey E
Current Estimated Value
Purchase Details
Closed on
Jan 29, 2009
Sold by
Kelly Shawn and Kelly Alison
Bought by
Kane Robert and Kane Abbey
Home Financials for this Owner
Home Financials are based on the most recent Mortgage that was taken out on this home.
Original Mortgage
$180,000
Interest Rate
5.28%
Mortgage Type
Purchase Money Mortgage
Purchase Details
Closed on
May 7, 1997
Sold by
Karcz Harriet
Bought by
Kelly Shawn and Klorer Alison
Home Financials for this Owner
Home Financials are based on the most recent Mortgage that was taken out on this home.
Original Mortgage
$76,200
Interest Rate
7.88%
Mortgage Type
Purchase Money Mortgage
Create a Home Valuation Report for This Property
The Home Valuation Report is an in-depth analysis detailing your home's value as well as a comparison with similar homes in the area
Home Values in the Area
Average Home Value in this Area
Purchase History
| Date | Buyer | Sale Price | Title Company |
|---|---|---|---|
| Kane Abbey E | -- | None Available | |
| Kane Robert | $200,000 | -- | |
| Kelly Shawn | $78,000 | -- |
Source: Public Records
Mortgage History
| Date | Status | Borrower | Loan Amount |
|---|---|---|---|
| Previous Owner | Kelly Shawn | $173,578 | |
| Previous Owner | Kelly Shawn | $180,000 | |
| Previous Owner | Kelly Shawn | $79,500 | |
| Previous Owner | Kelly Shawn | $76,200 |
Source: Public Records
Tax History
| Year | Tax Paid | Tax Assessment Tax Assessment Total Assessment is a certain percentage of the fair market value that is determined by local assessors to be the total taxable value of land and additions on the property. | Land | Improvement |
|---|---|---|---|---|
| 2025 | $4,550 | $131,300 | $46,900 | $84,400 |
| 2024 | $4,439 | $131,300 | $46,900 | $84,400 |
| 2023 | $4,367 | $131,300 | $46,900 | $84,400 |
| 2022 | $4,016 | $131,300 | $46,900 | $84,400 |
| 2021 | $3,955 | $105,800 | $38,860 | $66,940 |
| 2020 | $3,955 | $105,800 | $38,860 | $66,940 |
| 2019 | $3,955 | $105,800 | $38,860 | $66,940 |
| 2018 | $3,867 | $105,800 | $38,860 | $66,940 |
| 2017 | $3,659 | $105,800 | $38,860 | $66,940 |
| 2016 | $3,541 | $104,110 | $38,860 | $65,250 |
| 2015 | $3,440 | $104,110 | $38,860 | $65,250 |
| 2014 | $3,361 | $104,110 | $38,860 | $65,250 |
Source: Public Records
Map
Nearby Homes
- 27 Booth St
- 11 Willard Ave
- 27 Massachusetts Ave
- 79 Roosevelt Blvd
- 11 Nevins Ave
- 1423 Longmeadow St
- 2 Sharren Ln
- 31 Sharren Ln
- 50 Roosevelt Blvd
- 35 Bernardino Ave
- 32 Magnolia Dr
- 41 Field Rd
- 20 Manning Rd
- 25 First Ave
- Lot 114 Bark Haul Rd
- 9 Eleanor Rd
- 9 Virginia Ave
- 17 Douglas Dr
- 56 Liberty Ln
- 46 Liberty Ln
Your Personal Tour Guide
Ask me questions while you tour the home.