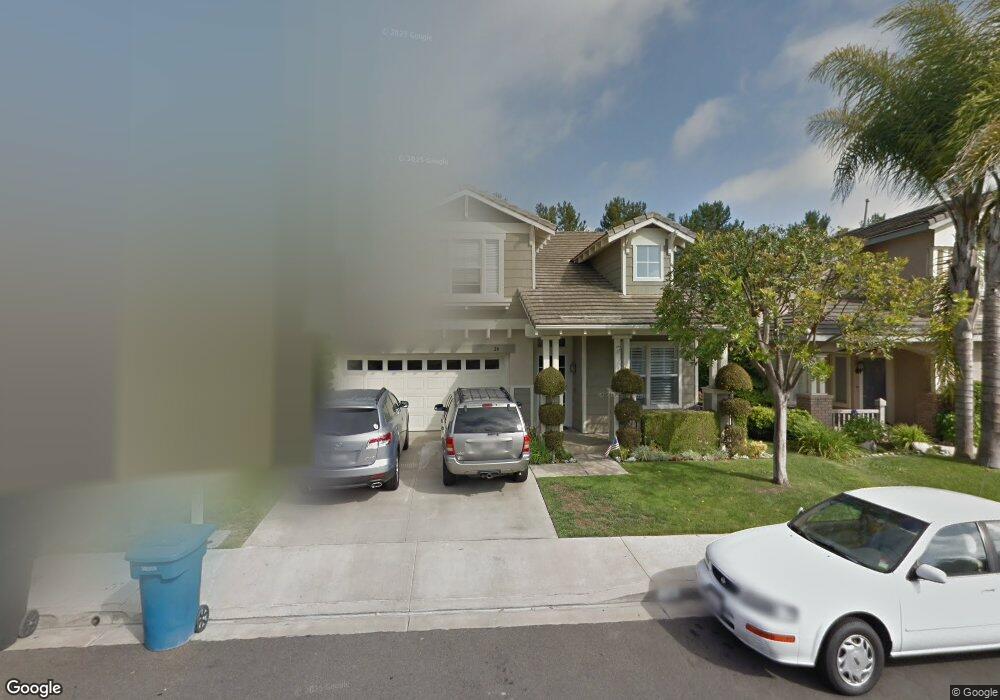
24 Stone Pine Aliso Viejo, CA 92656
Estimated Value: $1,532,000 - $1,700,000
4
Beds
3
Baths
2,257
Sq Ft
$720/Sq Ft
Est. Value
About This Home
This home is located at 24 Stone Pine, Aliso Viejo, CA 92656 and is currently estimated at $1,625,107, approximately $720 per square foot. 24 Stone Pine is a home located in Orange County with nearby schools including Don Juan Avila Middle School, Aliso Niguel High School, and Journey.
Ownership History
Date
Name
Owned For
Owner Type
Purchase Details
Closed on
Aug 27, 2019
Sold by
Miller Dale R and Miller Robin A
Bought by
Miller Dale R and Miller Robin A
Current Estimated Value
Home Financials for this Owner
Home Financials are based on the most recent Mortgage that was taken out on this home.
Original Mortgage
$165,000
Outstanding Balance
$145,115
Interest Rate
3.8%
Mortgage Type
New Conventional
Estimated Equity
$1,479,992
Purchase Details
Closed on
Jan 25, 2018
Sold by
Miller Dale R and Miller Robin A
Bought by
Miller Dale R and Miller Robin A
Purchase Details
Closed on
Oct 3, 1996
Sold by
John Laing Homes Inc
Bought by
Miller Dale R and Miller Robin A
Home Financials for this Owner
Home Financials are based on the most recent Mortgage that was taken out on this home.
Original Mortgage
$169,550
Interest Rate
8.3%
Create a Home Valuation Report for This Property
The Home Valuation Report is an in-depth analysis detailing your home's value as well as a comparison with similar homes in the area
Home Values in the Area
Average Home Value in this Area
Purchase History
| Date | Buyer | Sale Price | Title Company |
|---|---|---|---|
| Miller Dale R | -- | North American Title Company | |
| Miller Dale R | -- | North American Title Company | |
| Miller Dale R | -- | None Available | |
| Miller Dale R | $212,000 | First American Title Ins |
Source: Public Records
Mortgage History
| Date | Status | Borrower | Loan Amount |
|---|---|---|---|
| Open | Miller Dale R | $165,000 | |
| Closed | Miller Dale R | $169,550 |
Source: Public Records
Tax History Compared to Growth
Tax History
| Year | Tax Paid | Tax Assessment Tax Assessment Total Assessment is a certain percentage of the fair market value that is determined by local assessors to be the total taxable value of land and additions on the property. | Land | Improvement |
|---|---|---|---|---|
| 2025 | $3,631 | $372,832 | $73,288 | $299,544 |
| 2024 | $3,631 | $365,522 | $71,851 | $293,671 |
| 2023 | $3,546 | $358,355 | $70,442 | $287,913 |
| 2022 | $3,476 | $351,329 | $69,061 | $282,268 |
| 2021 | $3,406 | $344,441 | $67,707 | $276,734 |
| 2020 | $3,370 | $340,910 | $67,013 | $273,897 |
| 2019 | $3,303 | $334,226 | $65,699 | $268,527 |
| 2018 | $3,237 | $327,673 | $64,411 | $263,262 |
| 2017 | $3,172 | $321,249 | $63,149 | $258,100 |
| 2016 | $3,069 | $314,950 | $61,910 | $253,040 |
| 2015 | $3,647 | $310,220 | $60,980 | $249,240 |
| 2014 | $3,355 | $281,644 | $59,786 | $221,858 |
Source: Public Records
Map
Nearby Homes
- 36 Baneberry
- 32 Rockrose
- 39 Red Bud Unit 50
- 38 Red Bud
- 2 Carlsbad Ln Unit 179
- 66 Elderwood
- 29 Sandbridge
- 22 Cayman Brac
- 31 Cayman Brac
- 23 Fawnridge Place
- 15 Harvest Point Ln
- 302 San Nicholas Ct
- 511 San Nicholas Ct Unit 511
- 14 Mosaic
- 29 Sobrante
- 7 Cape Victoria Unit 67
- 34 Carmel Ct
- 28 Sandpiper Ln
- 47 Solitaire Ln
- 126 Cinnamon Teal