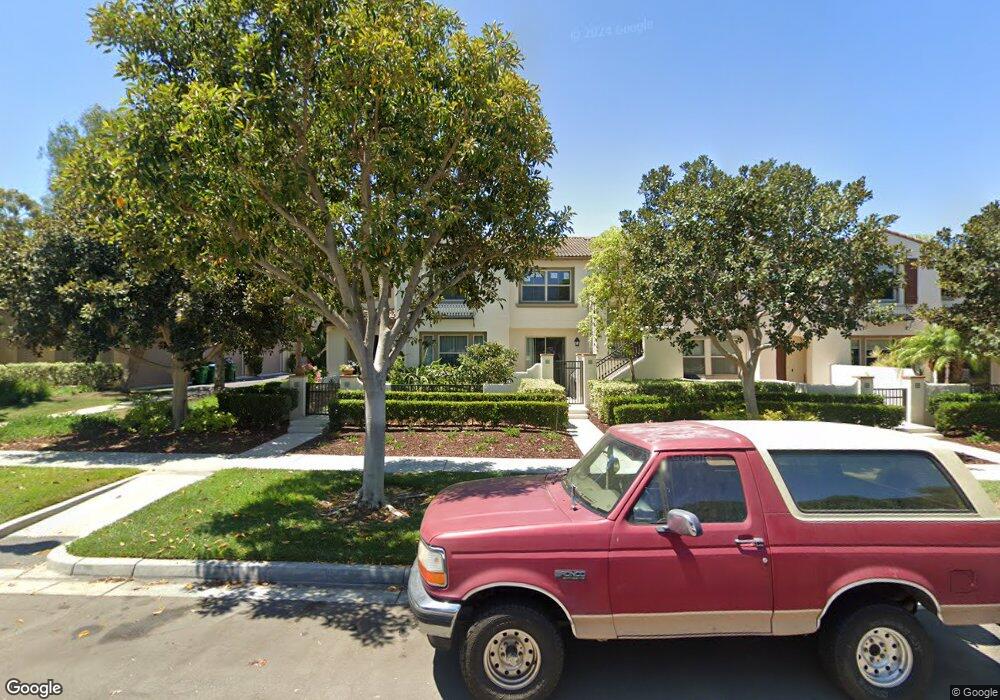
24 Strata Unit 48 Irvine, CA 92618
Woodbury and Stonegate NeighborhoodEstimated Value: $1,038,000 - $1,325,000
3
Beds
2
Baths
1,390
Sq Ft
$818/Sq Ft
Est. Value
About This Home
This home is located at 24 Strata Unit 48, Irvine, CA 92618 and is currently estimated at $1,136,716, approximately $817 per square foot. 24 Strata Unit 48 is a home located in Orange County with nearby schools including Jeffrey Trail Middle, Portola High School, and Woodbury Elementary School.
Ownership History
Date
Name
Owned For
Owner Type
Purchase Details
Closed on
Nov 12, 2009
Sold by
William Lyon Homes Inc
Bought by
Kim David
Current Estimated Value
Home Financials for this Owner
Home Financials are based on the most recent Mortgage that was taken out on this home.
Original Mortgage
$300,000
Outstanding Balance
$195,988
Interest Rate
5.01%
Mortgage Type
New Conventional
Estimated Equity
$940,728
Create a Home Valuation Report for This Property
The Home Valuation Report is an in-depth analysis detailing your home's value as well as a comparison with similar homes in the area
Home Values in the Area
Average Home Value in this Area
Purchase History
| Date | Buyer | Sale Price | Title Company |
|---|---|---|---|
| Kim David | $400,500 | Fidelity National Title |
Source: Public Records
Mortgage History
| Date | Status | Borrower | Loan Amount |
|---|---|---|---|
| Open | Kim David | $300,000 |
Source: Public Records
Tax History Compared to Growth
Tax History
| Year | Tax Paid | Tax Assessment Tax Assessment Total Assessment is a certain percentage of the fair market value that is determined by local assessors to be the total taxable value of land and additions on the property. | Land | Improvement |
|---|---|---|---|---|
| 2025 | $7,611 | $516,582 | $282,624 | $233,958 |
| 2024 | $7,611 | $506,453 | $277,082 | $229,371 |
| 2023 | $7,732 | $496,523 | $271,649 | $224,874 |
| 2022 | $7,603 | $486,788 | $266,323 | $220,465 |
| 2021 | $7,502 | $477,244 | $261,101 | $216,143 |
| 2020 | $7,456 | $472,351 | $258,424 | $213,927 |
| 2019 | $7,376 | $463,090 | $253,357 | $209,733 |
| 2018 | $7,282 | $454,010 | $248,389 | $205,621 |
| 2017 | $7,257 | $445,108 | $243,518 | $201,590 |
| 2016 | $7,098 | $436,381 | $238,743 | $197,638 |
| 2015 | $7,032 | $429,827 | $235,157 | $194,670 |
| 2014 | $6,947 | $421,408 | $230,551 | $190,857 |
Source: Public Records
Map
Nearby Homes