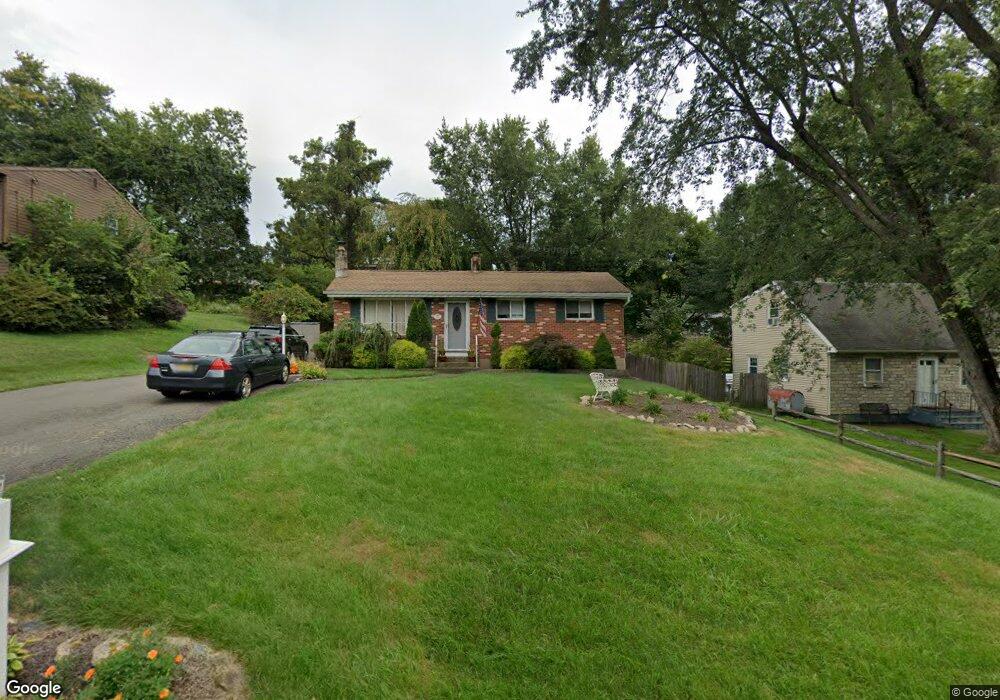
24 Sylvan Rd High Bridge, NJ 08829
Estimated Value: $379,000 - $524,000
--
Bed
--
Bath
912
Sq Ft
$503/Sq Ft
Est. Value
About This Home
This home is located at 24 Sylvan Rd, High Bridge, NJ 08829 and is currently estimated at $458,401, approximately $502 per square foot. 24 Sylvan Rd is a home located in Hunterdon County with nearby schools including High Bridge Elementary School, High Bridge Middle School, and Voorhees High School.
Ownership History
Date
Name
Owned For
Owner Type
Purchase Details
Closed on
Aug 11, 1994
Sold by
Sweikata Richard M and Sweikata Susanne M
Bought by
Moore John S and Moore Clara
Current Estimated Value
Purchase Details
Closed on
Nov 5, 1992
Sold by
Anderson V Brian
Bought by
Sweitkata Richard M and Sweitkata Susanne M
Create a Home Valuation Report for This Property
The Home Valuation Report is an in-depth analysis detailing your home's value as well as a comparison with similar homes in the area
Home Values in the Area
Average Home Value in this Area
Purchase History
| Date | Buyer | Sale Price | Title Company |
|---|---|---|---|
| Moore John S | $136,000 | -- | |
| Sweitkata Richard M | $123,500 | -- |
Source: Public Records
Tax History Compared to Growth
Tax History
| Year | Tax Paid | Tax Assessment Tax Assessment Total Assessment is a certain percentage of the fair market value that is determined by local assessors to be the total taxable value of land and additions on the property. | Land | Improvement |
|---|---|---|---|---|
| 2025 | $11,434 | $360,700 | $181,500 | $179,200 |
| 2024 | $10,312 | $350,300 | $142,900 | $207,400 |
| 2023 | $10,312 | $260,800 | $107,200 | $153,600 |
| 2022 | $10,531 | $247,500 | $94,600 | $152,900 |
| 2021 | $8,167 | $245,800 | $94,600 | $151,200 |
| 2020 | $3,879 | $94,600 | $94,600 | $0 |
| 2019 | $8,167 | $197,700 | $94,600 | $103,100 |
| 2018 | $7,760 | $195,800 | $92,000 | $103,800 |
| 2017 | $7,820 | $202,900 | $101,500 | $101,400 |
| 2016 | $7,728 | $202,900 | $101,500 | $101,400 |
| 2015 | $7,519 | $202,900 | $101,500 | $101,400 |
| 2014 | $8,202 | $239,200 | $137,700 | $101,500 |
Source: Public Records
Map
Nearby Homes