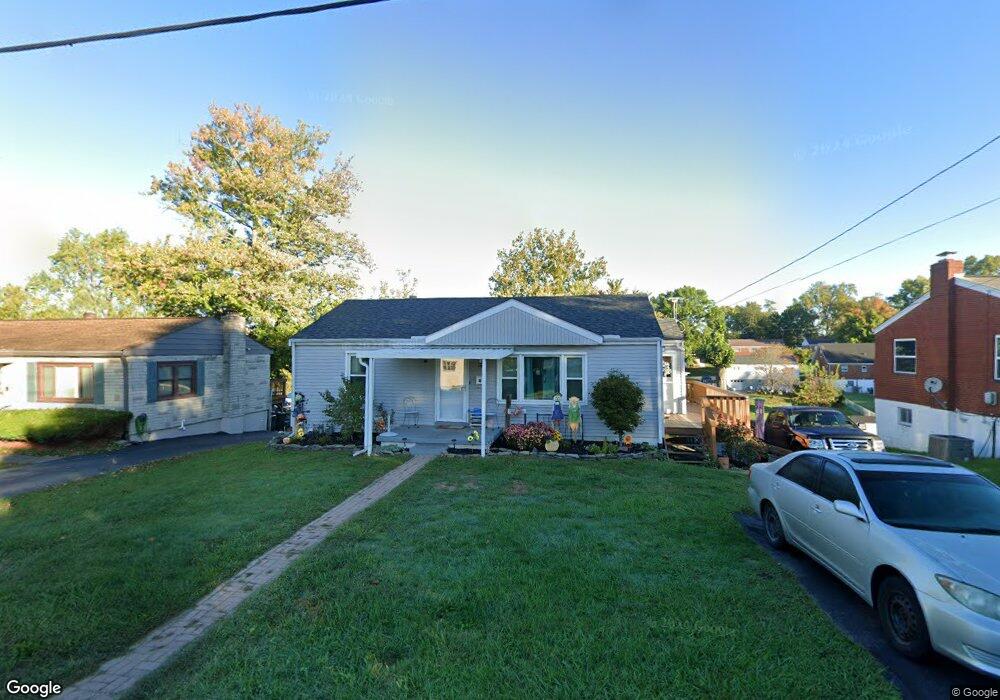
24 Trapp Ct Alexandria, KY 41001
Estimated Value: $151,000 - $222,000
3
Beds
1
Bath
948
Sq Ft
$202/Sq Ft
Est. Value
About This Home
This home is located at 24 Trapp Ct, Alexandria, KY 41001 and is currently estimated at $191,862, approximately $202 per square foot. 24 Trapp Ct is a home located in Campbell County with nearby schools including Campbell Ridge Elementary School, Campbell County Middle School, and Campbell County High School.
Ownership History
Date
Name
Owned For
Owner Type
Purchase Details
Closed on
Jul 24, 2019
Sold by
Fay Angela Suzanne Logan and Estate Of Patrick J Fay
Bought by
Fay Angela Suzanne Logan
Current Estimated Value
Purchase Details
Closed on
Aug 13, 1997
Sold by
Baker Justice C
Bought by
Fay Patrick J
Home Financials for this Owner
Home Financials are based on the most recent Mortgage that was taken out on this home.
Original Mortgage
$83,000
Interest Rate
7.65%
Mortgage Type
New Conventional
Purchase Details
Closed on
Mar 4, 1997
Sold by
Quest Dev Inc
Bought by
Baker Justine C and Baker Annette
Home Financials for this Owner
Home Financials are based on the most recent Mortgage that was taken out on this home.
Original Mortgage
$75,971
Interest Rate
7.91%
Mortgage Type
FHA
Purchase Details
Closed on
Oct 7, 1996
Sold by
Coble Ronald J
Bought by
Quest Dev Inc
Home Financials for this Owner
Home Financials are based on the most recent Mortgage that was taken out on this home.
Original Mortgage
$54,000
Interest Rate
8.25%
Mortgage Type
New Conventional
Create a Home Valuation Report for This Property
The Home Valuation Report is an in-depth analysis detailing your home's value as well as a comparison with similar homes in the area
Home Values in the Area
Average Home Value in this Area
Purchase History
| Date | Buyer | Sale Price | Title Company |
|---|---|---|---|
| Fay Angela Suzanne Logan | $45,550 | None Available | |
| Fay Patrick J | $83,000 | -- | |
| Baker Justine C | $76,500 | -- | |
| Quest Dev Inc | $50,000 | -- |
Source: Public Records
Mortgage History
| Date | Status | Borrower | Loan Amount |
|---|---|---|---|
| Previous Owner | Fay Patrick J | $83,000 | |
| Previous Owner | Baker Justine C | $75,971 | |
| Previous Owner | Quest Dev Inc | $54,000 |
Source: Public Records
Tax History
| Year | Tax Paid | Tax Assessment Tax Assessment Total Assessment is a certain percentage of the fair market value that is determined by local assessors to be the total taxable value of land and additions on the property. | Land | Improvement |
|---|---|---|---|---|
| 2025 | $1,488 | $124,800 | $30,000 | $94,800 |
| 2024 | $1,508 | $124,800 | $30,000 | $94,800 |
| 2023 | $1,473 | $124,800 | $30,000 | $94,800 |
| 2022 | $1,168 | $91,100 | $20,000 | $71,100 |
| 2021 | $1,182 | $91,100 | $20,000 | $71,100 |
| 2020 | $1,198 | $91,100 | $20,000 | $71,100 |
| 2019 | $1,187 | $91,100 | $20,000 | $71,100 |
| 2018 | $1,117 | $84,800 | $13,700 | $71,100 |
| 2017 | $1,105 | $84,800 | $13,700 | $71,100 |
| 2016 | $1,051 | $84,800 | $0 | $0 |
| 2015 | $1,075 | $84,800 | $0 | $0 |
| 2014 | $1,149 | $94,300 | $0 | $0 |
Source: Public Records
Map
Nearby Homes
- 7737 Devonshire Dr
- 745 Bluestem Ridge Dr
- 746 Bluestem Ridge Dr
- 802 Bluestem Ridge Dr
- 880 Cliffside Dr
- 882 Cliffside Dr
- 8304 Bluff Dr Unit B
- 8303 Bluff Dr Unit A
- 8303 Bluff Dr Unit C
- 8303 Bluff Dr Unit C
- 8303 Bluff Dr Unit B
- 8303 Bluff Dr Unit B
- 906 Riffle Ridge Unit B
- 906 Riffle Ridge Unit C
- 906 Riffle Ridge Unit A
- 889 Riffle Ridge Unit B
- 889 Riffle Ridge Unit A
- 921 Riffle Ridge Unit B
- 24 Panorama Dr
- 7912 Alexandria Pike
Your Personal Tour Guide
Ask me questions while you tour the home.