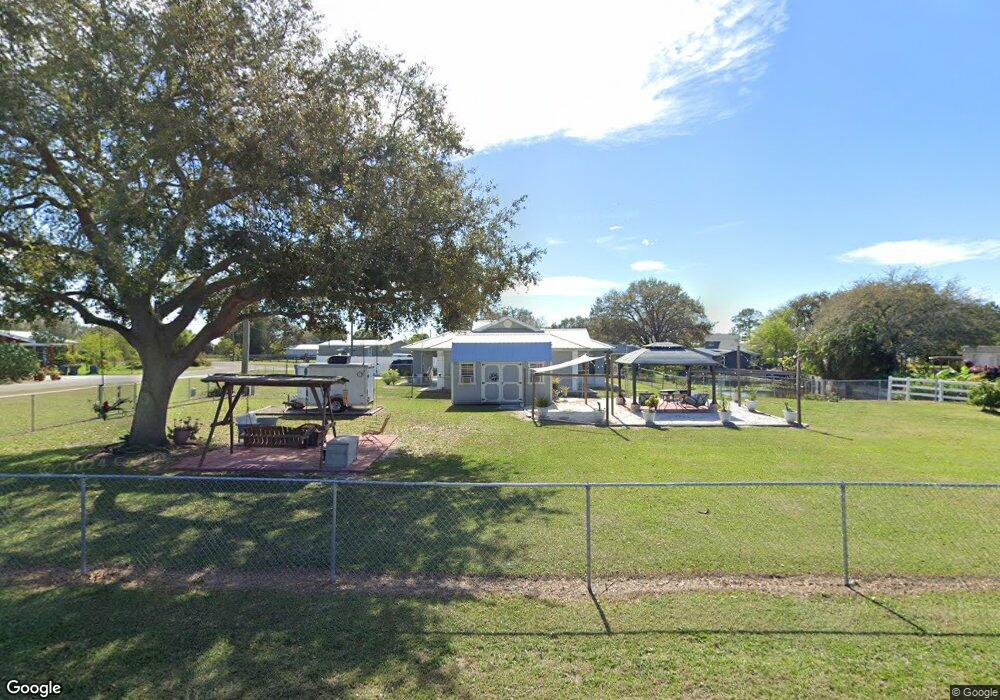
24 Trout St Okeechobee, FL 34974
Estimated Value: $225,099 - $311,000
2
Beds
1
Bath
896
Sq Ft
$315/Sq Ft
Est. Value
About This Home
This home is located at 24 Trout St, Okeechobee, FL 34974 and is currently estimated at $282,025, approximately $314 per square foot. 24 Trout St is a home located in Glades County with nearby schools including Moore Haven Junior/Senior High School and Moore Haven Elementary School.
Ownership History
Date
Name
Owned For
Owner Type
Purchase Details
Closed on
Apr 9, 2021
Sold by
Kuster Charles S
Bought by
Whisman Belinda J and Whisman Corinna M
Current Estimated Value
Home Financials for this Owner
Home Financials are based on the most recent Mortgage that was taken out on this home.
Original Mortgage
$145,000
Outstanding Balance
$130,349
Interest Rate
3%
Mortgage Type
VA
Estimated Equity
$151,676
Purchase Details
Closed on
Jul 26, 2013
Sold by
Fulce Jack
Bought by
Kuster Ii Charles S and Kuster Donna T
Home Financials for this Owner
Home Financials are based on the most recent Mortgage that was taken out on this home.
Original Mortgage
$112,000
Interest Rate
4%
Mortgage Type
VA
Purchase Details
Closed on
Apr 12, 2010
Sold by
Finnegan Daisy M and Finnegan Daisy
Bought by
Fulce Jack
Purchase Details
Closed on
Feb 8, 2005
Sold by
Finnegan Daisy M
Bought by
Finnegan Daisy M and Finnegen Arnold
Create a Home Valuation Report for This Property
The Home Valuation Report is an in-depth analysis detailing your home's value as well as a comparison with similar homes in the area
Home Values in the Area
Average Home Value in this Area
Purchase History
| Date | Buyer | Sale Price | Title Company |
|---|---|---|---|
| Whisman Belinda J | $145,000 | Attorney | |
| Kuster Ii Charles S | $112,000 | None Available | |
| Fulce Jack | $20,000 | None Available | |
| Finnegan Daisy M | -- | Attorney |
Source: Public Records
Mortgage History
| Date | Status | Borrower | Loan Amount |
|---|---|---|---|
| Open | Whisman Belinda J | $145,000 | |
| Previous Owner | Kuster Ii Charles S | $112,000 |
Source: Public Records
Tax History
| Year | Tax Paid | Tax Assessment Tax Assessment Total Assessment is a certain percentage of the fair market value that is determined by local assessors to be the total taxable value of land and additions on the property. | Land | Improvement |
|---|---|---|---|---|
| 2025 | $2,136 | $167,860 | -- | -- |
| 2023 | $2,068 | $158,378 | $0 | $0 |
| 2022 | $1,889 | $148,465 | $55,752 | $92,713 |
| 2021 | $2,431 | $125,580 | $0 | $0 |
| 2020 | $2,318 | $119,590 | $0 | $0 |
| 2019 | $2,315 | $119,586 | $51,750 | $67,836 |
| 2018 | $2,194 | $112,309 | $0 | $0 |
| 2017 | $2,201 | $112,309 | $46,920 | $65,389 |
| 2016 | $2,253 | $113,149 | $0 | $0 |
| 2015 | $2,047 | $102,412 | $0 | $0 |
| 2014 | $2,104 | $104,239 | $0 | $0 |
Source: Public Records
Map
Nearby Homes
Your Personal Tour Guide
Ask me questions while you tour the home.