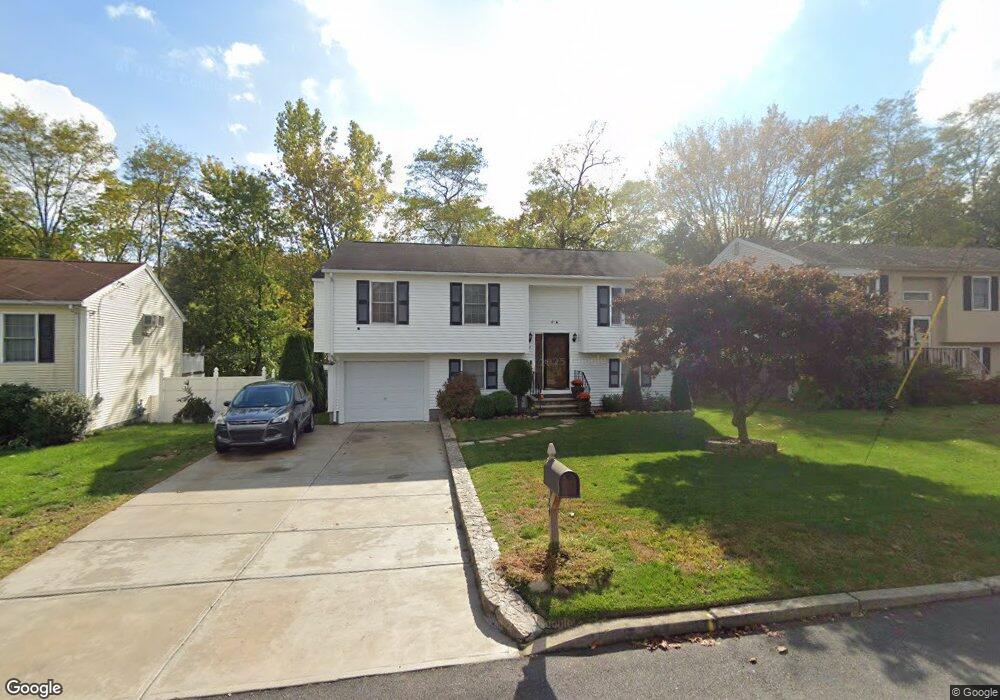
24 Urquhart St Cranston, RI 02920
Budlong NeighborhoodEstimated Value: $413,881 - $483,000
3
Beds
1
Bath
1,104
Sq Ft
$421/Sq Ft
Est. Value
About This Home
This home is located at 24 Urquhart St, Cranston, RI 02920 and is currently estimated at $464,720, approximately $420 per square foot. 24 Urquhart St is a home located in Providence County with nearby schools including Woodridge Elementary School, Western Hills Middle School, and Cranston High School West.
Ownership History
Date
Name
Owned For
Owner Type
Purchase Details
Closed on
Jul 27, 2001
Sold by
Fraioll Mario
Bought by
Johnson Rosario M
Current Estimated Value
Home Financials for this Owner
Home Financials are based on the most recent Mortgage that was taken out on this home.
Original Mortgage
$139,650
Interest Rate
7.18%
Purchase Details
Closed on
Oct 23, 1998
Sold by
Boutin Anthony
Bought by
Fraioli Marie R
Home Financials for this Owner
Home Financials are based on the most recent Mortgage that was taken out on this home.
Original Mortgage
$94,400
Interest Rate
6.74%
Purchase Details
Closed on
Apr 23, 1997
Sold by
Darezzo Anthony A
Bought by
Boutin Anthony
Home Financials for this Owner
Home Financials are based on the most recent Mortgage that was taken out on this home.
Original Mortgage
$65,000
Interest Rate
7.77%
Create a Home Valuation Report for This Property
The Home Valuation Report is an in-depth analysis detailing your home's value as well as a comparison with similar homes in the area
Home Values in the Area
Average Home Value in this Area
Purchase History
| Date | Buyer | Sale Price | Title Company |
|---|---|---|---|
| Johnson Rosario M | $147,000 | -- | |
| Fraioli Marie R | $105,000 | -- | |
| Boutin Anthony | $30,000 | -- |
Source: Public Records
Mortgage History
| Date | Status | Borrower | Loan Amount |
|---|---|---|---|
| Open | Boutin Anthony | $137,500 | |
| Closed | Boutin Anthony | $139,650 | |
| Previous Owner | Boutin Anthony | $94,400 | |
| Previous Owner | Boutin Anthony | $65,000 |
Source: Public Records
Tax History Compared to Growth
Tax History
| Year | Tax Paid | Tax Assessment Tax Assessment Total Assessment is a certain percentage of the fair market value that is determined by local assessors to be the total taxable value of land and additions on the property. | Land | Improvement |
|---|---|---|---|---|
| 2025 | $4,911 | $353,800 | $99,600 | $254,200 |
| 2024 | $4,815 | $353,800 | $99,600 | $254,200 |
| 2023 | $4,814 | $254,700 | $68,700 | $186,000 |
| 2022 | $4,714 | $254,700 | $68,700 | $186,000 |
| 2021 | $4,585 | $254,700 | $68,700 | $186,000 |
| 2020 | $4,609 | $221,900 | $65,200 | $156,700 |
| 2019 | $4,609 | $221,900 | $65,200 | $156,700 |
| 2018 | $4,502 | $221,900 | $65,200 | $156,700 |
| 2017 | $4,338 | $189,100 | $48,100 | $141,000 |
| 2016 | $4,245 | $189,100 | $48,100 | $141,000 |
| 2015 | $4,245 | $189,100 | $48,100 | $141,000 |
| 2014 | $3,725 | $163,100 | $48,100 | $115,000 |
Source: Public Records
Map
Nearby Homes