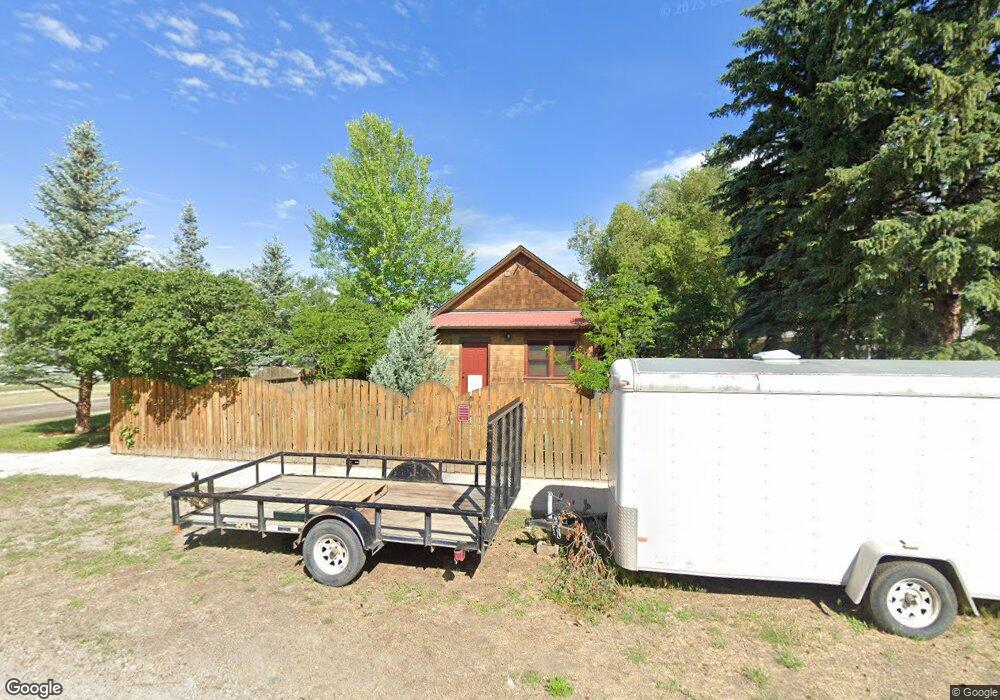
24 W Front St Three Forks, MT 59752
Estimated Value: $396,747 - $441,000
3
Beds
1
Bath
948
Sq Ft
$439/Sq Ft
Est. Value
About This Home
This home is located at 24 W Front St, Three Forks, MT 59752 and is currently estimated at $416,187, approximately $439 per square foot. 24 W Front St is a home located in Gallatin County with nearby schools including Three Forks Elementary School, Three Forks Junior High School, and Three Forks High School.
Ownership History
Date
Name
Owned For
Owner Type
Purchase Details
Closed on
May 24, 2021
Sold by
Marquez Barbara and Marquez David
Bought by
Marquez Barbara and Marquez David
Current Estimated Value
Home Financials for this Owner
Home Financials are based on the most recent Mortgage that was taken out on this home.
Original Mortgage
$160,000
Interest Rate
4.38%
Mortgage Type
New Conventional
Purchase Details
Closed on
Jun 1, 2006
Sold by
Spatzierath Chad
Bought by
Lowry Barbara and Marquez David
Home Financials for this Owner
Home Financials are based on the most recent Mortgage that was taken out on this home.
Original Mortgage
$133,941
Interest Rate
6.52%
Mortgage Type
FHA
Purchase Details
Closed on
May 10, 2005
Sold by
Hostler Sherman E and Hostler Crystal S
Bought by
Spatzierath Chad
Home Financials for this Owner
Home Financials are based on the most recent Mortgage that was taken out on this home.
Original Mortgage
$99,439
Interest Rate
6.02%
Mortgage Type
FHA
Create a Home Valuation Report for This Property
The Home Valuation Report is an in-depth analysis detailing your home's value as well as a comparison with similar homes in the area
Purchase History
| Date | Buyer | Sale Price | Title Company |
|---|---|---|---|
| Marquez Barbara | -- | None Listed On Document | |
| Lowry Barbara | -- | Montana Title & Escrow | |
| Spatzierath Chad | -- | American Land Title Company |
Source: Public Records
Mortgage History
| Date | Status | Borrower | Loan Amount |
|---|---|---|---|
| Previous Owner | Marquez Barbara | $160,000 | |
| Previous Owner | Lowry Barbara | $133,941 | |
| Previous Owner | Spatzierath Chad | $99,439 |
Source: Public Records
Tax History
| Year | Tax Paid | Tax Assessment Tax Assessment Total Assessment is a certain percentage of the fair market value that is determined by local assessors to be the total taxable value of land and additions on the property. | Land | Improvement |
|---|---|---|---|---|
| 2025 | $1,710 | $449,400 | $0 | $0 |
| 2024 | $2,449 | $379,200 | $0 | $0 |
| 2023 | $2,617 | $379,200 | $0 | $0 |
| 2022 | $1,861 | $230,800 | $0 | $0 |
| 2021 | $1,929 | $230,800 | $0 | $0 |
| 2020 | $1,676 | $178,700 | $0 | $0 |
| 2019 | $1,361 | $178,700 | $0 | $0 |
| 2018 | $1,314 | $154,600 | $0 | $0 |
| 2017 | $1,290 | $154,600 | $0 | $0 |
| 2016 | $1,280 | $155,900 | $0 | $0 |
| 2015 | $1,308 | $155,900 | $0 | $0 |
| 2014 | $1,177 | $84,693 | $0 | $0 |
Source: Public Records
Map
Nearby Homes
- 8 E Front St
- 206 1st Ave W
- 210 1st Ave W
- TBD Mt Hwy 2 Lot 1
- 408 S Main St
- 515 2nd Ave W
- 620 3rd Ave W
- 724 3rd Ave W
- 323 W Ivy St
- 623 E Neal St
- 720 & 722 1st Ave E
- 607 E Elm St
- 5211 Old Yellowstone Trail
- NHN Old Town Rd
- Lot 23 Aurora Loop Morning Sky Estates
- TBD Wild Rose
- Lot 22 Aurora Loop Morning Sky Estates
- 103 Star View Dr
- TBD Madison Rd
- Tbd Lewis Dr
Your Personal Tour Guide
Ask me questions while you tour the home.