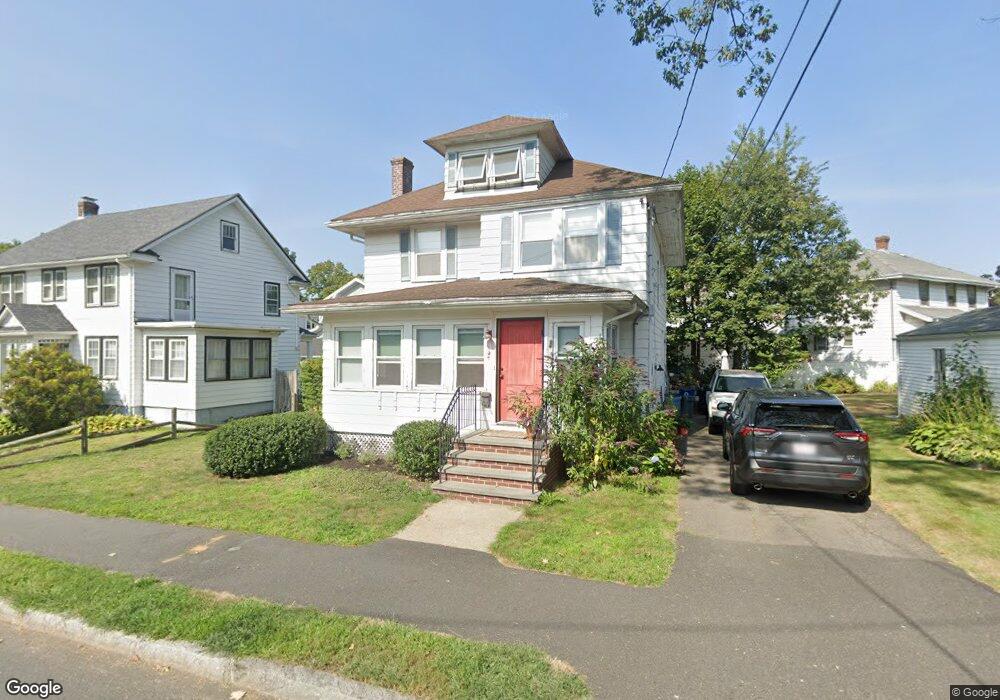
24 Waban Rd Quincy, MA 02169
Merrymount NeighborhoodEstimated Value: $749,868 - $833,000
4
Beds
2
Baths
1,548
Sq Ft
$510/Sq Ft
Est. Value
About This Home
This home is located at 24 Waban Rd, Quincy, MA 02169 and is currently estimated at $790,217, approximately $510 per square foot. 24 Waban Rd is a home located in Norfolk County with nearby schools including Merrymount Elementary School, Central Middle School, and Quincy High School.
Ownership History
Date
Name
Owned For
Owner Type
Purchase Details
Closed on
Nov 25, 1997
Sold by
Martin Kathleen M
Bought by
Obrien Sean J and Obrien Virginia M
Current Estimated Value
Purchase Details
Closed on
Dec 30, 1988
Sold by
Zona Peter C
Bought by
Martin Kathleen M
Create a Home Valuation Report for This Property
The Home Valuation Report is an in-depth analysis detailing your home's value as well as a comparison with similar homes in the area
Home Values in the Area
Average Home Value in this Area
Purchase History
| Date | Buyer | Sale Price | Title Company |
|---|---|---|---|
| Obrien Sean J | $197,000 | -- | |
| Martin Kathleen M | $175,000 | -- |
Source: Public Records
Mortgage History
| Date | Status | Borrower | Loan Amount |
|---|---|---|---|
| Open | Martin Kathleen M | $273,660 | |
| Closed | Martin Kathleen M | $177,300 |
Source: Public Records
Tax History Compared to Growth
Tax History
| Year | Tax Paid | Tax Assessment Tax Assessment Total Assessment is a certain percentage of the fair market value that is determined by local assessors to be the total taxable value of land and additions on the property. | Land | Improvement |
|---|---|---|---|---|
| 2025 | $7,227 | $626,800 | $339,400 | $287,400 |
| 2024 | $6,830 | $606,000 | $329,500 | $276,500 |
| 2023 | $6,104 | $548,400 | $286,500 | $261,900 |
| 2022 | $6,012 | $501,800 | $238,700 | $263,100 |
| 2021 | $5,728 | $471,800 | $238,700 | $233,100 |
| 2020 | $5,597 | $450,300 | $229,500 | $220,800 |
| 2019 | $5,419 | $431,800 | $214,500 | $217,300 |
| 2018 | $4,992 | $374,200 | $178,100 | $196,100 |
| 2017 | $5,220 | $368,400 | $186,500 | $181,900 |
| 2016 | $5,053 | $351,900 | $183,200 | $168,700 |
| 2015 | $4,780 | $327,400 | $172,800 | $154,600 |
| 2014 | $4,544 | $305,800 | $167,700 | $138,100 |
Source: Public Records
Map
Nearby Homes
- 1421 Quincy Shore Dr
- 188 Samoset Ave
- 1427 Quincy Shore Dr
- 105 Sea St Unit 301
- 105 Sea St Unit 203
- 105 Sea St Unit 105
- 37 Hobomack Rd
- 100 Thornton St
- 20 Putnam St
- 74 Butler Rd
- 1025 Hancock St Unit 2K
- 140 Phillips St
- 20 Whitney Rd Unit 1
- 163 Clay St Unit C
- 1 Adams St Unit 707
- 45 Oval Rd Unit 6
- 22 Newton Ave
- 10 Presidents Ln Unit 10
- 165 Old Colony Ave Unit A
- 73 Albatross Rd