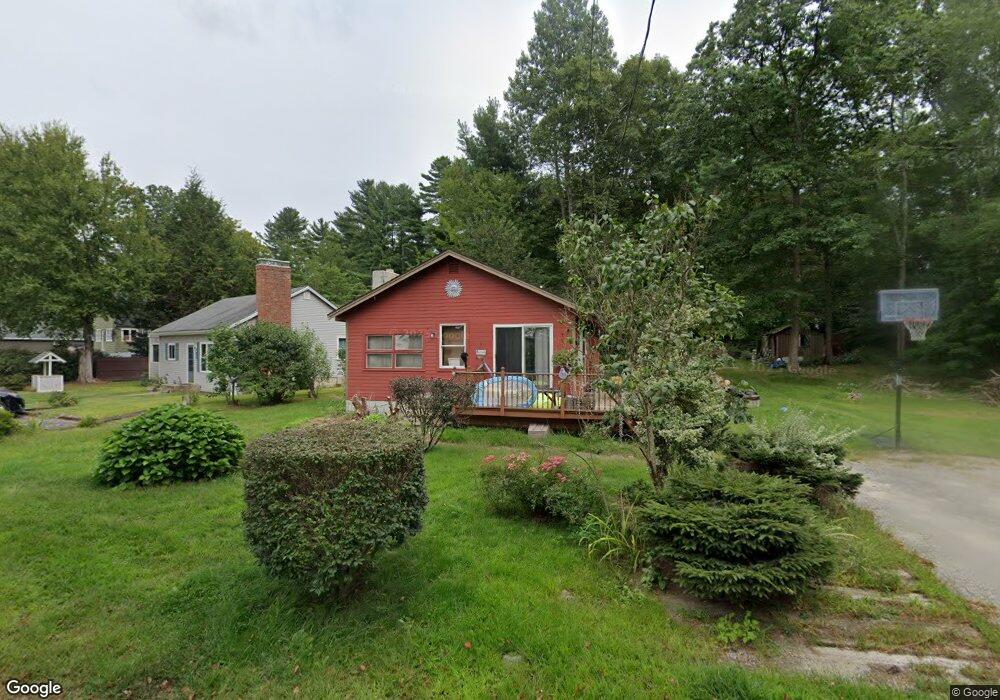
24 Wenmarks Rd Newton, NH 03858
Estimated Value: $352,364 - $454,000
2
Beds
2
Baths
897
Sq Ft
$448/Sq Ft
Est. Value
About This Home
This home is located at 24 Wenmarks Rd, Newton, NH 03858 and is currently estimated at $401,841, approximately $447 per square foot. 24 Wenmarks Rd is a home located in Rockingham County with nearby schools including Memorial School, Sanborn Regional Middle School, and Sanborn Regional High School.
Ownership History
Date
Name
Owned For
Owner Type
Purchase Details
Closed on
Jun 28, 2002
Sold by
Labelle Scott and Labelle Kristen
Bought by
Tremblay David S
Current Estimated Value
Home Financials for this Owner
Home Financials are based on the most recent Mortgage that was taken out on this home.
Original Mortgage
$131,920
Outstanding Balance
$56,755
Interest Rate
6.92%
Estimated Equity
$345,086
Purchase Details
Closed on
Aug 31, 2000
Sold by
Desmond Isabel and Desmond James D
Bought by
Labelle Scott and Labelle Kristen
Home Financials for this Owner
Home Financials are based on the most recent Mortgage that was taken out on this home.
Original Mortgage
$117,420
Interest Rate
8.16%
Purchase Details
Closed on
Aug 23, 1996
Sold by
Chadwick Philip E
Bought by
Grasso Isabel
Home Financials for this Owner
Home Financials are based on the most recent Mortgage that was taken out on this home.
Original Mortgage
$69,350
Interest Rate
8.4%
Create a Home Valuation Report for This Property
The Home Valuation Report is an in-depth analysis detailing your home's value as well as a comparison with similar homes in the area
Home Values in the Area
Average Home Value in this Area
Purchase History
| Date | Buyer | Sale Price | Title Company |
|---|---|---|---|
| Tremblay David S | $164,900 | -- | |
| Labelle Scott | $123,600 | -- | |
| Grasso Isabel | $73,000 | -- |
Source: Public Records
Mortgage History
| Date | Status | Borrower | Loan Amount |
|---|---|---|---|
| Open | Grasso Isabel | $131,920 | |
| Previous Owner | Grasso Isabel | $117,420 | |
| Previous Owner | Grasso Isabel | $69,350 |
Source: Public Records
Tax History Compared to Growth
Tax History
| Year | Tax Paid | Tax Assessment Tax Assessment Total Assessment is a certain percentage of the fair market value that is determined by local assessors to be the total taxable value of land and additions on the property. | Land | Improvement |
|---|---|---|---|---|
| 2024 | $5,886 | $232,000 | $125,600 | $106,400 |
| 2023 | $5,710 | $232,000 | $125,600 | $106,400 |
| 2022 | $5,218 | $232,000 | $125,600 | $106,400 |
| 2021 | $4,849 | $232,000 | $125,600 | $106,400 |
| 2020 | $7 | $232,000 | $125,600 | $106,400 |
| 2019 | $4,545 | $172,300 | $88,700 | $83,600 |
| 2018 | $4,407 | $172,300 | $88,700 | $83,600 |
| 2017 | $4,580 | $172,300 | $88,700 | $83,600 |
| 2016 | $4,507 | $172,300 | $88,700 | $83,600 |
| 2015 | $4,509 | $172,300 | $88,700 | $83,600 |
| 2014 | $4,034 | $155,500 | $80,600 | $74,900 |
| 2013 | $3,934 | $155,500 | $80,600 | $74,900 |
Source: Public Records
Map
Nearby Homes
- 62 & 43 Wilders Grove Rd
- 21 Marcoux Rd
- 56 Whittier St
- 12 W Shore Park Rd
- 21 W Shore Park Rd
- 8 Chongor Dr
- 2 Country Pond Rd
- 129 New Hampshire 125
- 1 Kinneret Dr
- 28 Morning Dove Rd
- 10 Folly Brook Terrace
- 14 Folly Brook Terrace Unit B
- 7 Grebenstein Dr
- 25 Crane Crossing Rd
- 7 Coopers Grove Rd
- 17 Maple Ave
- 57b New Boston Rd
- 39 Colby Rd
- 43 Maple Ave
- 32 Main St