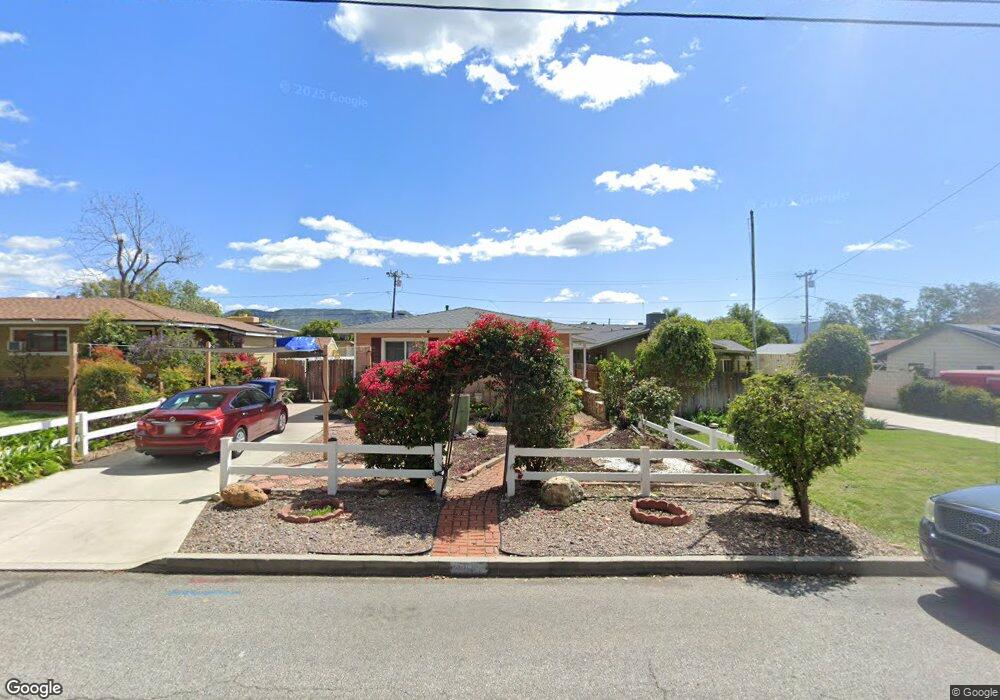
240 4th St Fillmore, CA 93015
Estimated Value: $646,000 - $690,000
3
Beds
2
Baths
1,216
Sq Ft
$545/Sq Ft
Est. Value
About This Home
This home is located at 240 4th St, Fillmore, CA 93015 and is currently estimated at $662,341, approximately $544 per square foot. 240 4th St is a home located in Ventura County with nearby schools including San Cayetano Elementary School and Fillmore Senior High.
Ownership History
Date
Name
Owned For
Owner Type
Purchase Details
Closed on
Oct 13, 2021
Sold by
Jonathan Carreno Joel
Bought by
Carreno Joel Jonathan and Carreno Jack A
Current Estimated Value
Home Financials for this Owner
Home Financials are based on the most recent Mortgage that was taken out on this home.
Original Mortgage
$227,000
Interest Rate
5.27%
Mortgage Type
New Conventional
Purchase Details
Closed on
Apr 25, 2007
Sold by
Carreno Joel Jonathan
Bought by
Carreno Joel Jonathan and Carreno Jack A
Purchase Details
Closed on
Oct 9, 2006
Sold by
Carreno Jack A
Bought by
Carreno Joel Jonathan
Purchase Details
Closed on
Mar 23, 2005
Sold by
Stenseth Brian and Stenseth Cynthia A
Bought by
Carreno Jack A and Carreno Joel Jonathan
Home Financials for this Owner
Home Financials are based on the most recent Mortgage that was taken out on this home.
Original Mortgage
$285,000
Interest Rate
6.87%
Mortgage Type
New Conventional
Create a Home Valuation Report for This Property
The Home Valuation Report is an in-depth analysis detailing your home's value as well as a comparison with similar homes in the area
Home Values in the Area
Average Home Value in this Area
Purchase History
| Date | Buyer | Sale Price | Title Company |
|---|---|---|---|
| Carreno Joel Jonathan | $113,500 | Wfg Lender Services | |
| Carreno Joel Jonathan | -- | Lawyers Title Company | |
| Carreno Joel Jonathan | -- | Alliance Title Company | |
| Carreno Jack A | $485,000 | First American Title Co |
Source: Public Records
Mortgage History
| Date | Status | Borrower | Loan Amount |
|---|---|---|---|
| Previous Owner | Carreno Joel Jonathan | $227,000 | |
| Previous Owner | Carreno Jack A | $285,000 |
Source: Public Records
Tax History
| Year | Tax Paid | Tax Assessment Tax Assessment Total Assessment is a certain percentage of the fair market value that is determined by local assessors to be the total taxable value of land and additions on the property. | Land | Improvement |
|---|---|---|---|---|
| 2025 | $6,030 | $614,000 | $400,000 | $214,000 |
| 2024 | $6,030 | $542,000 | $353,000 | $189,000 |
| 2023 | $6,414 | $573,000 | $373,000 | $200,000 |
| 2022 | $6,002 | $569,000 | $370,000 | $199,000 |
| 2021 | $5,813 | $475,000 | $392,000 | $83,000 |
| 2020 | $4,617 | $403,000 | $333,000 | $70,000 |
| 2019 | $4,663 | $398,000 | $329,000 | $69,000 |
| 2018 | $4,306 | $368,000 | $304,000 | $64,000 |
| 2017 | $4,381 | $365,000 | $302,000 | $63,000 |
| 2016 | $3,691 | $326,000 | $270,000 | $56,000 |
| 2015 | $3,226 | $289,000 | $239,000 | $50,000 |
| 2014 | $3,269 | $286,000 | $237,000 | $49,000 |
Source: Public Records
Map
Nearby Homes
- 345 Blaine Ave
- 639 Mountain View St
- 616 Island View St
- 318 Bard St
- 809 Woodgrove Rd
- 815 Woodgrove Rd
- 404 Central Ave
- 340 Central Ave
- 831 Blaine Ave
- 252 Driftwood St
- 199 Rosewood St
- 81 Wildwood Ln
- 949 Blaine Ave
- 915 E Telegraph Rd
- 309 Heritage Valley Pkwy
- 250 E Telegraph Rd Unit 200
- 250 E Telegraph Rd Unit 68
- 250 E Telegraph Rd Unit 135
- 250 E Telegraph Rd Unit 213
- 250 E Telegraph Rd Unit 248
Your Personal Tour Guide
Ask me questions while you tour the home.