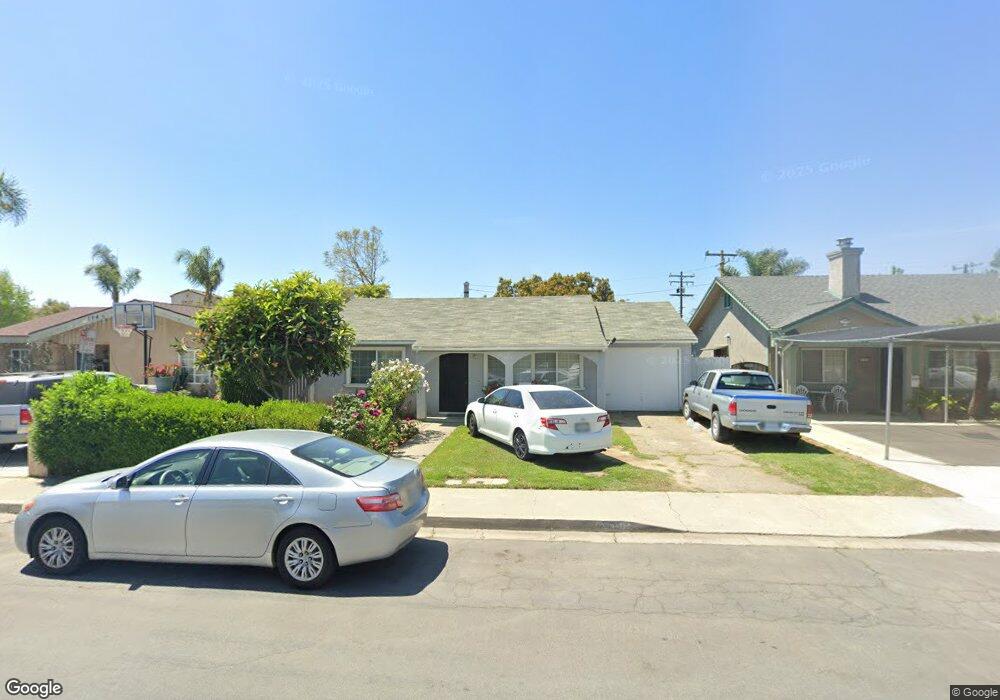
240 Craig Dr Santa Paula, CA 93060
Estimated Value: $495,000 - $692,000
2
Beds
1
Bath
833
Sq Ft
$679/Sq Ft
Est. Value
About This Home
This home is located at 240 Craig Dr, Santa Paula, CA 93060 and is currently estimated at $565,629, approximately $679 per square foot. 240 Craig Dr is a home located in Ventura County with nearby schools including Glen City Elementary School, Isbell Middle, and Santa Paula High.
Ownership History
Date
Name
Owned For
Owner Type
Purchase Details
Closed on
May 19, 2000
Sold by
Francisco Dominguez and Adrian Dominguez
Bought by
Mendez Gustavo R and Mendez Ninfa E
Current Estimated Value
Home Financials for this Owner
Home Financials are based on the most recent Mortgage that was taken out on this home.
Original Mortgage
$161,020
Outstanding Balance
$55,547
Interest Rate
8.12%
Estimated Equity
$510,082
Purchase Details
Closed on
Dec 22, 1994
Sold by
Security Pacific National Bank
Bought by
Dominguez Francisco and Dominguez Adrian
Home Financials for this Owner
Home Financials are based on the most recent Mortgage that was taken out on this home.
Original Mortgage
$115,400
Interest Rate
9.21%
Purchase Details
Closed on
Sep 7, 1994
Sold by
Security Pacific National Bank and Lopez Antonio
Bought by
Security Pacific National Bank
Create a Home Valuation Report for This Property
The Home Valuation Report is an in-depth analysis detailing your home's value as well as a comparison with similar homes in the area
Home Values in the Area
Average Home Value in this Area
Purchase History
| Date | Buyer | Sale Price | Title Company |
|---|---|---|---|
| Mendez Gustavo R | $166,000 | Lawyers Title Company | |
| Dominguez Francisco | $119,000 | First American Title Ins Co | |
| Security Pacific National Bank | $132,199 | Stewart Title |
Source: Public Records
Mortgage History
| Date | Status | Borrower | Loan Amount |
|---|---|---|---|
| Open | Mendez Gustavo R | $161,020 | |
| Previous Owner | Dominguez Francisco | $115,400 |
Source: Public Records
Tax History Compared to Growth
Tax History
| Year | Tax Paid | Tax Assessment Tax Assessment Total Assessment is a certain percentage of the fair market value that is determined by local assessors to be the total taxable value of land and additions on the property. | Land | Improvement |
|---|---|---|---|---|
| 2025 | $2,877 | $255,108 | $102,041 | $153,067 |
| 2024 | $2,877 | $250,106 | $100,040 | $150,066 |
| 2023 | $2,817 | $245,202 | $98,078 | $147,124 |
| 2022 | $2,734 | $240,395 | $96,155 | $144,240 |
| 2021 | $2,724 | $235,682 | $94,270 | $141,412 |
| 2020 | $2,710 | $233,267 | $93,304 | $139,963 |
| 2019 | $2,563 | $228,694 | $91,475 | $137,219 |
| 2018 | $2,530 | $224,211 | $89,682 | $134,529 |
| 2017 | $2,557 | $219,816 | $87,924 | $131,892 |
| 2016 | $2,404 | $215,506 | $86,200 | $129,306 |
| 2015 | $2,297 | $212,270 | $84,906 | $127,364 |
| 2014 | $2,332 | $208,114 | $83,244 | $124,870 |
Source: Public Records
Map
Nearby Homes
- 33 Outer Dr Unit 33
- 102 E Ventura St Unit D
- 102 E Ventura St Unit A
- 352 Moultrie Place
- 107 Sonoma Ln
- 324 W Santa Barbara St
- 362 W Santa Barbara St
- 1848 Jojoba Dr
- 413 Checkerbloom Ln
- 1856 Jojoba Dr
- 1865 Jojoba Dr
- 455 Snowdrop Ln
- 457 Snowdrop Ln
- 154 E Santa Maria St
- 342 Princeton St
- 605 Elfred Ct
- 336 E Harvard Blvd
- 525 W Santa Barbara St
- 0 Dickenson Rd
- 500 W Santa Maria St Unit 43
- 236 Craig Dr
- 244 Craig Dr
- 230 Craig Dr
- 228 Craig Dr
- 238 Moultrie Place
- 236 W Harvard Blvd
- 239 Craig Dr
- 237 Craig Dr
- 222 Craig Dr
- 245 Craig Dr
- 216 W Harvard Blvd
- 231 Craig Dr
- 236 Moultrie Place
- 224 W Harvard Blvd
- 242 Moultrie Place
- 227 Craig Dr
- 218 Craig Dr
- 308 Craig Dr
- 223 Craig Dr
- 232 W Harvard Blvd