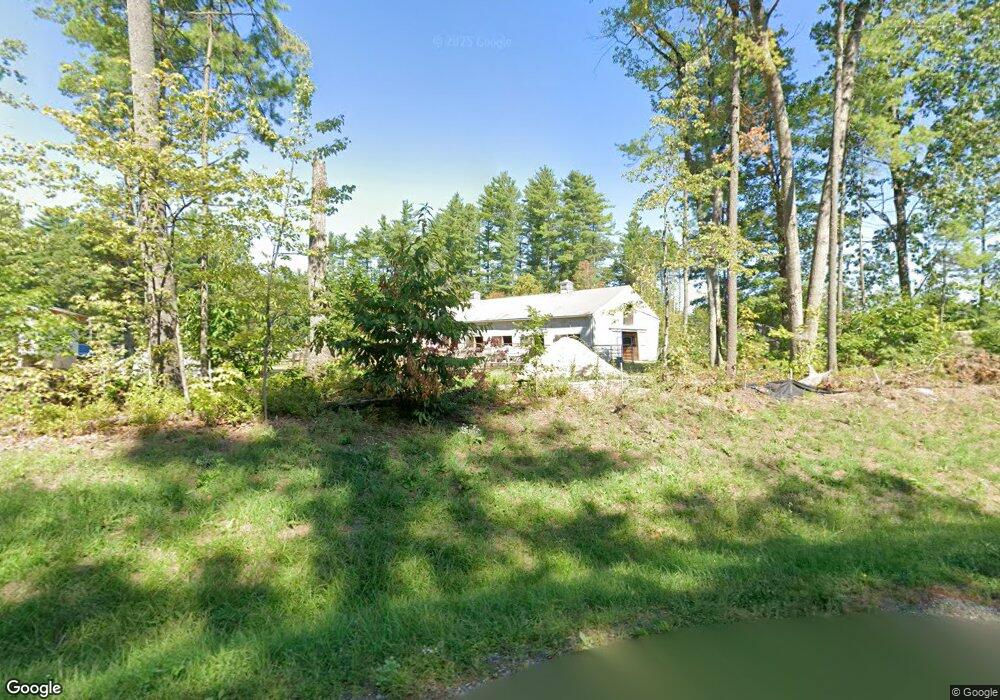
240 Depot Rd Hollis, NH 03049
Hollis NeighborhoodEstimated Value: $605,000 - $722,000
4
Beds
1
Bath
1,683
Sq Ft
$393/Sq Ft
Est. Value
About This Home
This home is located at 240 Depot Rd, Hollis, NH 03049 and is currently estimated at $662,227, approximately $393 per square foot. 240 Depot Rd is a home with nearby schools including Hollis Primary School, Hollis Upper Elementary School, and Hollis-Brookline Middle School.
Ownership History
Date
Name
Owned For
Owner Type
Purchase Details
Closed on
May 31, 2007
Sold by
Orde Douglas A
Bought by
Ux Alan W and Ux Stacey
Current Estimated Value
Home Financials for this Owner
Home Financials are based on the most recent Mortgage that was taken out on this home.
Original Mortgage
$270,750
Outstanding Balance
$166,119
Interest Rate
6.24%
Mortgage Type
Purchase Money Mortgage
Estimated Equity
$496,108
Create a Home Valuation Report for This Property
The Home Valuation Report is an in-depth analysis detailing your home's value as well as a comparison with similar homes in the area
Home Values in the Area
Average Home Value in this Area
Purchase History
| Date | Buyer | Sale Price | Title Company |
|---|---|---|---|
| Ux Alan W | $285,000 | -- |
Source: Public Records
Mortgage History
| Date | Status | Borrower | Loan Amount |
|---|---|---|---|
| Open | Ux Alan W | $100,000 | |
| Open | Ux Alan W | $270,750 | |
| Previous Owner | Ux Alan W | $30,000 |
Source: Public Records
Tax History Compared to Growth
Tax History
| Year | Tax Paid | Tax Assessment Tax Assessment Total Assessment is a certain percentage of the fair market value that is determined by local assessors to be the total taxable value of land and additions on the property. | Land | Improvement |
|---|---|---|---|---|
| 2024 | $9,824 | $554,100 | $264,800 | $289,300 |
| 2023 | $9,231 | $554,100 | $264,800 | $289,300 |
| 2022 | $12,506 | $554,100 | $264,800 | $289,300 |
| 2021 | $8,631 | $380,200 | $177,600 | $202,600 |
| 2020 | $8,813 | $380,200 | $177,600 | $202,600 |
| 2019 | $8,783 | $380,200 | $177,600 | $202,600 |
| 2018 | $8,239 | $380,200 | $177,600 | $202,600 |
| 2017 | $6,940 | $299,800 | $157,600 | $142,200 |
| 2016 | $7,024 | $299,800 | $157,600 | $142,200 |
| 2015 | $6,901 | $299,800 | $157,600 | $142,200 |
| 2014 | $6,934 | $299,800 | $157,600 | $142,200 |
| 2013 | $6,841 | $299,800 | $157,600 | $142,200 |
Source: Public Records
Map
Nearby Homes